 Add to Chrome
 Add to Firefox
 Add to Edge
GSwap: Realistic Head Swapping with Dynamic Neural Gaussian Field
Mar 24, 2026We present GSwap, a novel consistent and realistic video head-swapping system empowered by dynamic neural Gaussian portrait priors, which significantly advances the state of the art in face and head replacement. Unlike previous methods that rely primarily on 2D generative models or 3D Morphable Face Models (3DMM), our approach overcomes their inherent limitations, including poor 3D consistency, unnatural facial expressions, and restricted synthesis quality. Moreover, existing techniques struggle with full head-swapping tasks due to insufficient holistic head modeling and ineffective background blending, often resulting in visible artifacts and misalignments. To address these challenges, GSwap introduces an intrinsic 3D Gaussian feature field embedded within a full-body SMPL-X surface, effectively elevating 2D portrait videos into a dynamic neural Gaussian field. This innovation ensures high-fidelity, 3D-consistent portrait rendering while preserving natural head-torso relationships and seamless motion dynamics. To facilitate training, we adapt a pretrained 2D portrait generative model to the source head domain using only a few reference images, enabling efficient domain adaptation. Furthermore, we propose a neural re-rendering strategy that harmoniously integrates the synthesized foreground with the original background, eliminating blending artifacts and enhancing realism. Extensive experiments demonstrate that GSwap surpasses existing methods in multiple aspects, including visual quality, temporal coherence, identity preservation, and 3D consistency.
The PokeAgent Challenge: Competitive and Long-Context Learning at Scale
Mar 17, 2026We present the PokeAgent Challenge, a large-scale benchmark for decision-making research built on Pokemon's multi-agent battle system and expansive role-playing game (RPG) environment. Partial observability, game-theoretic reasoning, and long-horizon planning remain open problems for frontier AI, yet few benchmarks stress all three simultaneously under realistic conditions. PokeAgent targets these limitations at scale through two complementary tracks: our Battling Track, which calls for strategic reasoning and generalization under partial observability in competitive Pokemon battles, and our Speedrunning Track, which requires long-horizon planning and sequential decision-making in the Pokemon RPG. Our Battling Track supplies a dataset of 20M+ battle trajectories alongside a suite of heuristic, RL, and LLM-based baselines capable of high-level competitive play. Our Speedrunning Track provides the first standardized evaluation framework for RPG speedrunning, including an open-source multi-agent orchestration system for modular, reproducible comparisons of harness-based LLM approaches. Our NeurIPS 2025 competition validates both the quality of our resources and the research community's interest in Pokemon, with over 100 teams competing across both tracks and winning solutions detailed in our paper. Participant submissions and our baselines reveal considerable gaps between generalist (LLM), specialist (RL), and elite human performance. Analysis against the BenchPress evaluation matrix shows that Pokemon battling is nearly orthogonal to standard LLM benchmarks, measuring capabilities not captured by existing suites and positioning Pokemon as an unsolved benchmark that can drive RL and LLM research forward. We transition to a living benchmark with a live leaderboard for Battling and self-contained evaluation for Speedrunning at https://pokeagentchallenge.com.
SigTime: Learning and Visually Explaining Time Series Signatures
Dec 12, 2025Understanding and distinguishing temporal patterns in time series data is essential for scientific discovery and decision-making. For example, in biomedical research, uncovering meaningful patterns in physiological signals can improve diagnosis, risk assessment, and patient outcomes. However, existing methods for time series pattern discovery face major challenges, including high computational complexity, limited interpretability, and difficulty in capturing meaningful temporal structures. To address these gaps, we introduce a novel learning framework that jointly trains two Transformer models using complementary time series representations: shapelet-based representations to capture localized temporal structures and traditional feature engineering to encode statistical properties. The learned shapelets serve as interpretable signatures that differentiate time series across classification labels. Additionally, we develop a visual analytics system -- SigTIme -- with coordinated views to facilitate exploration of time series signatures from multiple perspectives, aiding in useful insights generation. We quantitatively evaluate our learning framework on eight publicly available datasets and one proprietary clinical dataset. Additionally, we demonstrate the effectiveness of our system through two usage scenarios along with the domain experts: one involving public ECG data and the other focused on preterm labor analysis.
OG-PCL: Efficient Sparse Point Cloud Processing for Human Activity Recognition
Nov 12, 2025Human activity recognition (HAR) with millimeter-wave (mmWave) radar offers a privacy-preserving and robust alternative to camera- and wearable-based approaches. In this work, we propose the Occupancy-Gated Parallel-CNN Bi-LSTM (OG-PCL) network to process sparse 3D radar point clouds produced by mmWave sensing. Designed for lightweight deployment, the parameter size of the proposed OG-PCL is only 0.83M and achieves 91.75 accuracy on the RadHAR dataset, outperforming those existing baselines such as 2D CNN, PointNet, and 3D CNN methods. We validate the advantages of the tri-view parallel structure in preserving spatial information across three dimensions while maintaining efficiency through ablation studies. We further introduce the Occupancy-Gated Convolution (OGConv) block and demonstrate the necessity of its occupancy compensation mechanism for handling sparse point clouds. The proposed OG-PCL thus offers a compact yet accurate framework for real-time radar-based HAR on lightweight platforms.
PECL: A Heterogeneous Parallel Multi-Domain Network for Radar-Based Human Activity Recognition
Nov 07, 2025Radar systems are increasingly favored for medical applications because they provide non-intrusive monitoring with high privacy and robustness to lighting conditions. However, existing research typically relies on single-domain radar signals and overlooks the temporal dependencies inherent in human activity, which complicates the classification of similar actions. To address this issue, we designed the Parallel-EfficientNet-CBAM-LSTM (PECL) network to process data in three complementary domains: Range-Time, Doppler-Time, and Range-Doppler. PECL combines a channel-spatial attention module and temporal units to capture more features and dynamic dependencies during action sequences, improving both accuracy and robustness. The experimental results show that PECL achieves an accuracy of 96.16% on the same dataset, outperforming existing methods by at least 4.78%. PECL also performs best in distinguishing between easily confused actions. Despite its strong performance, PECL maintains moderate model complexity, with 23.42M parameters and 1324.82M FLOPs. Its parameter-efficient design further reduces computational cost.
Controlling Avatar Diffusion with Learnable Gaussian Embedding
Mar 20, 2025Recent advances in diffusion models have made significant progress in digital human generation. However, most existing models still struggle to maintain 3D consistency, temporal coherence, and motion accuracy. A key reason for these shortcomings is the limited representation ability of commonly used control signals(e.g., landmarks, depth maps, etc.). In addition, the lack of diversity in identity and pose variations in public datasets further hinders progress in this area. In this paper, we analyze the shortcomings of current control signals and introduce a novel control signal representation that is optimizable, dense, expressive, and 3D consistent. Our method embeds a learnable neural Gaussian onto a parametric head surface, which greatly enhances the consistency and expressiveness of diffusion-based head models. Regarding the dataset, we synthesize a large-scale dataset with multiple poses and identities. In addition, we use real/synthetic labels to effectively distinguish real and synthetic data, minimizing the impact of imperfections in synthetic data on the generated head images. Extensive experiments show that our model outperforms existing methods in terms of realism, expressiveness, and 3D consistency. Our code, synthetic datasets, and pre-trained models will be released in our project page: https://ustc3dv.github.io/Learn2Control/
MSCMHMST: A traffic flow prediction model based on Transformer
Mar 16, 2025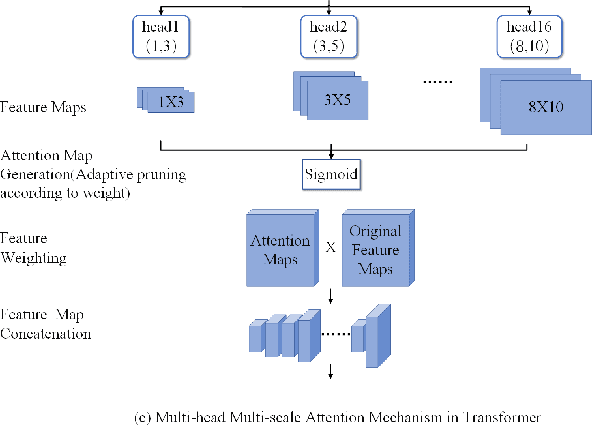
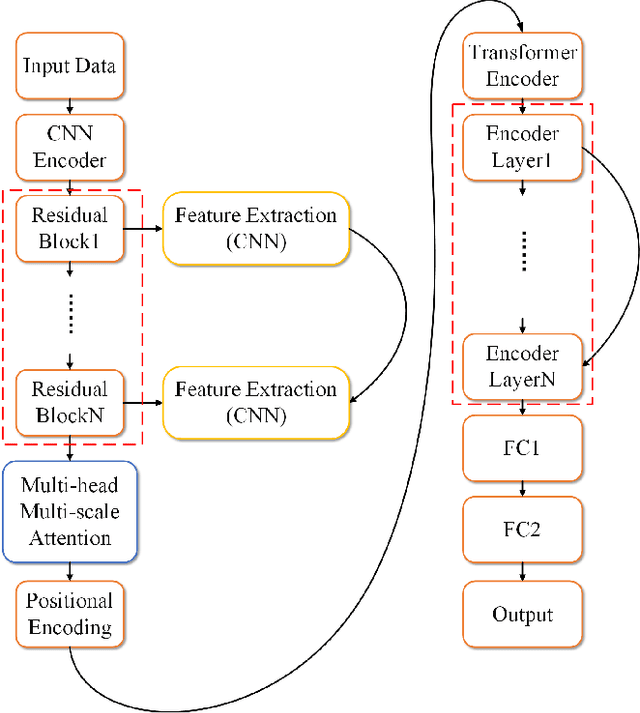
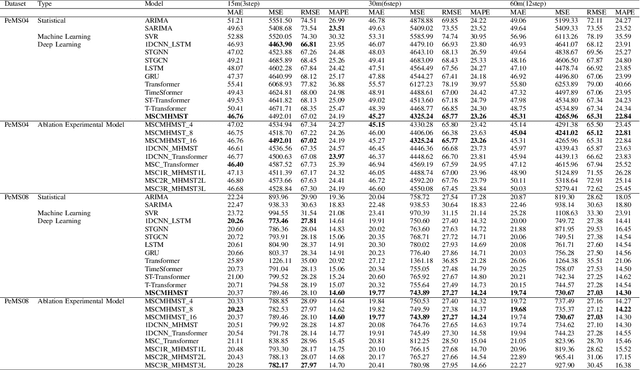
This study proposes a hybrid model based on Transformers, named MSCMHMST, aimed at addressing key challenges in traffic flow prediction. Traditional single-method approaches show limitations in traffic prediction tasks, whereas hybrid methods, by integrating the strengths of different models, can provide more accurate and robust predictions. The MSCMHMST model introduces a multi-head, multi-scale attention mechanism, allowing the model to parallel process different parts of the data and learn its intrinsic representations from multiple perspectives, thereby enhancing the model's ability to handle complex situations. This mechanism enables the model to capture features at various scales effectively, understanding both short-term changes and long-term trends. Verified through experiments on the PeMS04/08 dataset with specific experimental settings, the MSCMHMST model demonstrated excellent robustness and accuracy in long, medium, and short-term traffic flow predictions. The results indicate that this model has significant potential, offering a new and effective solution for the field of traffic flow prediction.
InterChat: Enhancing Generative Visual Analytics using Multimodal Interactions
Mar 06, 2025


The rise of Large Language Models (LLMs) and generative visual analytics systems has transformed data-driven insights, yet significant challenges persist in accurately interpreting users' analytical and interaction intents. While language inputs offer flexibility, they often lack precision, making the expression of complex intents inefficient, error-prone, and time-intensive. To address these limitations, we investigate the design space of multimodal interactions for generative visual analytics through a literature review and pilot brainstorming sessions. Building on these insights, we introduce a highly extensible workflow that integrates multiple LLM agents for intent inference and visualization generation. We develop InterChat, a generative visual analytics system that combines direct manipulation of visual elements with natural language inputs. This integration enables precise intent communication and supports progressive, visually driven exploratory data analyses. By employing effective prompt engineering, and contextual interaction linking, alongside intuitive visualization and interaction designs, InterChat bridges the gap between user interactions and LLM-driven visualizations, enhancing both interpretability and usability. Extensive evaluations, including two usage scenarios, a user study, and expert feedback, demonstrate the effectiveness of InterChat. Results show significant improvements in the accuracy and efficiency of handling complex visual analytics tasks, highlighting the potential of multimodal interactions to redefine user engagement and analytical depth in generative visual analytics.
SVIA: A Street View Image Anonymization Framework for Self-Driving Applications
Jan 16, 2025


In recent years, there has been an increasing interest in image anonymization, particularly focusing on the de-identification of faces and individuals. However, for self-driving applications, merely de-identifying faces and individuals might not provide sufficient privacy protection since street views like vehicles and buildings can still disclose locations, trajectories, and other sensitive information. Therefore, it remains crucial to extend anonymization techniques to street view images to fully preserve the privacy of users, pedestrians, and vehicles. In this paper, we propose a Street View Image Anonymization (SVIA) framework for self-driving applications. The SVIA framework consists of three integral components: a semantic segmenter to segment an input image into functional regions, an inpainter to generate alternatives to privacy-sensitive regions, and a harmonizer to seamlessly stitch modified regions to guarantee visual coherence. Compared to existing methods, SVIA achieves a much better trade-off between image generation quality and privacy protection, as evidenced by experimental results for five common metrics on two widely used public datasets.
CATP: Context-Aware Trajectory Prediction with Competition Symbiosis
Jul 10, 2024


Contextual information is vital for accurate trajectory prediction. For instance, the intricate flying behavior of migratory birds hinges on their analysis of environmental cues such as wind direction and air pressure. However, the diverse and dynamic nature of contextual information renders it an arduous task for AI models to comprehend its impact on trajectories and consequently predict them accurately. To address this issue, we propose a ``manager-worker'' framework to unleash the full potential of contextual information and construct CATP model, an implementation of the framework for Context-Aware Trajectory Prediction. The framework comprises a manager model, several worker models, and a tailored training mechanism inspired by competition symbiosis in nature. Taking CATP as an example, each worker needs to compete against others for training data and develop an advantage in predicting specific moving patterns. The manager learns the workers' performance in different contexts and selects the best one in the given context to predict trajectories, enabling CATP as a whole to operate in a symbiotic manner. We conducted two comparative experiments and an ablation study to quantitatively evaluate the proposed framework and CATP model. The results showed that CATP could outperform SOTA models, and the framework could be generalized to different context-aware tasks.