Huamin Qu
MedKGI: Iterative Differential Diagnosis with Medical Knowledge Graphs and Information-Guided Inquiring
Dec 30, 2025Abstract:Recent advancements in Large Language Models (LLMs) have demonstrated significant promise in clinical diagnosis. However, current models struggle to emulate the iterative, diagnostic hypothesis-driven reasoning of real clinical scenarios. Specifically, current LLMs suffer from three critical limitations: (1) generating hallucinated medical content due to weak grounding in verified knowledge, (2) asking redundant or inefficient questions rather than discriminative ones that hinder diagnostic progress, and (3) losing coherence over multi-turn dialogues, leading to contradictory or inconsistent conclusions. To address these challenges, we propose MedKGI, a diagnostic framework grounded in clinical practices. MedKGI integrates a medical knowledge graph (KG) to constrain reasoning to validated medical ontologies, selects questions based on information gain to maximize diagnostic efficiency, and adopts an OSCE-format structured state to maintain consistent evidence tracking across turns. Experiments on clinical benchmarks show that MedKGI outperforms strong LLM baselines in both diagnostic accuracy and inquiry efficiency, improving dialogue efficiency by 30% on average while maintaining state-of-the-art accuracy.
VizDefender: Unmasking Visualization Tampering through Proactive Localization and Intent Inference
Dec 21, 2025
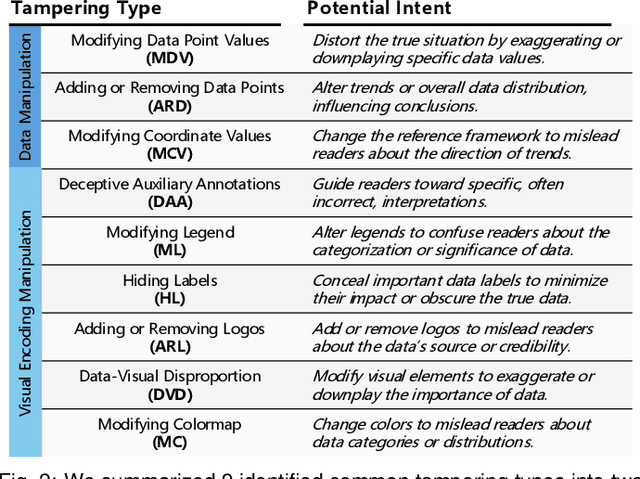

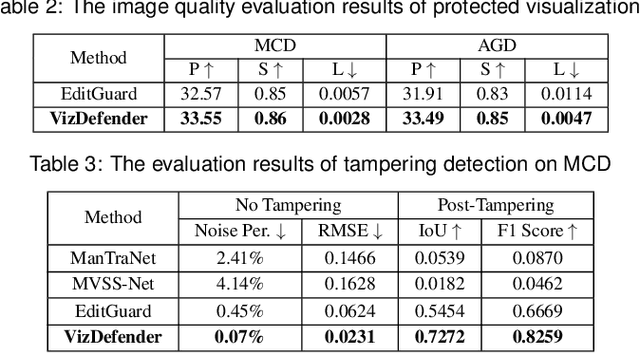
Abstract:The integrity of data visualizations is increasingly threatened by image editing techniques that enable subtle yet deceptive tampering. Through a formative study, we define this challenge and categorize tampering techniques into two primary types: data manipulation and visual encoding manipulation. To address this, we present VizDefender, a framework for tampering detection and analysis. The framework integrates two core components: 1) a semi-fragile watermark module that protects the visualization by embedding a location map to images, which allows for the precise localization of tampered regions while preserving visual quality, and 2) an intent analysis module that leverages Multimodal Large Language Models (MLLMs) to interpret manipulation, inferring the attacker's intent and misleading effects. Extensive evaluations and user studies demonstrate the effectiveness of our methods.
Hollywood Town: Long-Video Generation via Cross-Modal Multi-Agent Orchestration
Oct 25, 2025

Abstract:Recent advancements in multi-agent systems have demonstrated significant potential for enhancing creative task performance, such as long video generation. This study introduces three innovations to improve multi-agent collaboration. First, we propose OmniAgent, a hierarchical, graph-based multi-agent framework for long video generation that leverages a film-production-inspired architecture to enable modular specialization and scalable inter-agent collaboration. Second, inspired by context engineering, we propose hypergraph nodes that enable temporary group discussions among agents lacking sufficient context, reducing individual memory requirements while ensuring adequate contextual information. Third, we transition from directed acyclic graphs (DAGs) to directed cyclic graphs with limited retries, allowing agents to reflect and refine outputs iteratively, thereby improving earlier stages through feedback from subsequent nodes. These contributions lay the groundwork for developing more robust multi-agent systems in creative tasks.
HoloCine: Holistic Generation of Cinematic Multi-Shot Long Video Narratives
Oct 23, 2025Abstract:State-of-the-art text-to-video models excel at generating isolated clips but fall short of creating the coherent, multi-shot narratives, which are the essence of storytelling. We bridge this "narrative gap" with HoloCine, a model that generates entire scenes holistically to ensure global consistency from the first shot to the last. Our architecture achieves precise directorial control through a Window Cross-Attention mechanism that localizes text prompts to specific shots, while a Sparse Inter-Shot Self-Attention pattern (dense within shots but sparse between them) ensures the efficiency required for minute-scale generation. Beyond setting a new state-of-the-art in narrative coherence, HoloCine develops remarkable emergent abilities: a persistent memory for characters and scenes, and an intuitive grasp of cinematic techniques. Our work marks a pivotal shift from clip synthesis towards automated filmmaking, making end-to-end cinematic creation a tangible future. Our code is available at: https://holo-cine.github.io/.
Reflection on Data Storytelling Tools in the Generative AI Era from the Human-AI Collaboration Perspective
Mar 04, 2025Abstract:Human-AI collaborative tools attract attentions from the data storytelling community to lower the barrier of expertise and streamline the workflow. The recent advance in large-scale generative AI techniques, e.g., large language models (LLMs) and text-to-image models, has the potential to enhance data storytelling with their power in visual and narration generation. After two years since these techniques were publicly available, it is important to reflect our progress of applying them and have an outlook for future opportunities. To achieve the goal, we compare the collaboration patterns of the latest tools with those of earlier ones using a dedicated framework for understanding human-AI collaboration in data storytelling. Through comparison, we identify persistent collaboration patterns, e.g., human-creator + AI-assistant, and emerging ones, e.g., AI-creator + human-reviewer. The benefits of these AI techniques and other implications to human-AI collaboration are also revealed. We further propose future directions to hopefully ignite innovations.
AniDoc: Animation Creation Made Easier
Dec 18, 2024Abstract:The production of 2D animation follows an industry-standard workflow, encompassing four essential stages: character design, keyframe animation, in-betweening, and coloring. Our research focuses on reducing the labor costs in the above process by harnessing the potential of increasingly powerful generative AI. Using video diffusion models as the foundation, AniDoc emerges as a video line art colorization tool, which automatically converts sketch sequences into colored animations following the reference character specification. Our model exploits correspondence matching as an explicit guidance, yielding strong robustness to the variations (e.g., posture) between the reference character and each line art frame. In addition, our model could even automate the in-betweening process, such that users can easily create a temporally consistent animation by simply providing a character image as well as the start and end sketches. Our code is available at: https://yihao-meng.github.io/AniDoc_demo.
CLLMate: A Multimodal LLM for Weather and Climate Events Forecasting
Sep 27, 2024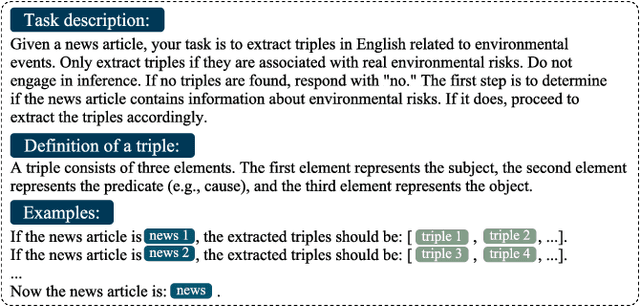

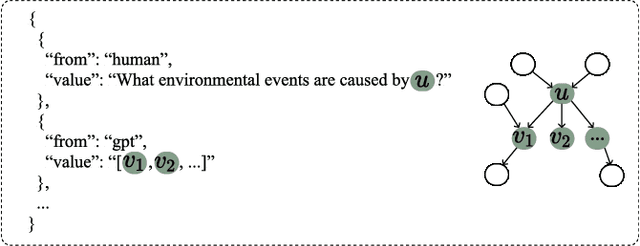

Abstract:Forecasting weather and climate events is crucial for making appropriate measures to mitigate environmental hazards and minimize associated losses. Previous research on environmental forecasting focuses on predicting numerical meteorological variables related to closed-set events rather than forecasting open-set events directly, which limits the comprehensiveness of event forecasting. We propose Weather and Climate Event Forecasting (WCEF), a new task that leverages meteorological raster data and textual event data to predict potential weather and climate events. However, due to difficulties in aligning multimodal data and the lack of sufficient supervised datasets, this task is challenging to accomplish. Therefore, we first propose a framework to align historical meteorological data with past weather and climate events using the large language model (LLM). In this framework, we construct a knowledge graph by using LLM to extract information about weather and climate events from a corpus of over 41k highly environment-focused news articles. Subsequently, we mapped these events with meteorological raster data, creating a supervised dataset, which is the largest and most novel for LLM tuning on the WCEF task. Finally, we introduced our aligned models, CLLMate (LLM for climate), a multimodal LLM to forecast weather and climate events using meteorological raster data. In evaluating CLLMate, we conducted extensive experiments. The results indicate that CLLMate surpasses both the baselines and other multimodal LLMs, showcasing the potential of utilizing LLM to align weather and climate events with meteorological data and highlighting the promising future for research on the WCEF task.
How Good (Or Bad) Are LLMs at Detecting Misleading Visualizations?
Jul 24, 2024


Abstract:In this study, we address the growing issue of misleading charts, a prevalent problem that undermines the integrity of information dissemination. Misleading charts can distort the viewer's perception of data, leading to misinterpretations and decisions based on false information. The development of effective automatic detection methods for misleading charts is an urgent field of research. The recent advancement of multimodal Large Language Models (LLMs) has introduced a promising direction for addressing this challenge. We explored the capabilities of these models in analyzing complex charts and assessing the impact of different prompting strategies on the models' analyses. We utilized a dataset of misleading charts collected from the internet by prior research and crafted nine distinct prompts, ranging from simple to complex, to test the ability of four different multimodal LLMs in detecting over 21 different chart issues. Through three experiments--from initial exploration to detailed analysis--we progressively gained insights into how to effectively prompt LLMs to identify misleading charts and developed strategies to address the scalability challenges encountered as we expanded our detection range from the initial five issues to 21 issues in the final experiment. Our findings reveal that multimodal LLMs possess a strong capability for chart comprehension and critical thinking in data interpretation. There is significant potential in employing multimodal LLMs to counter misleading information by supporting critical thinking and enhancing visualization literacy. This study demonstrates the applicability of LLMs in addressing the pressing concern of misleading charts.
StuGPTViz: A Visual Analytics Approach to Understand Student-ChatGPT Interactions
Jul 17, 2024


Abstract:The integration of Large Language Models (LLMs), especially ChatGPT, into education is poised to revolutionize students' learning experiences by introducing innovative conversational learning methodologies. To empower students to fully leverage the capabilities of ChatGPT in educational scenarios, understanding students' interaction patterns with ChatGPT is crucial for instructors. However, this endeavor is challenging due to the absence of datasets focused on student-ChatGPT conversations and the complexities in identifying and analyzing the evolutional interaction patterns within conversations. To address these challenges, we collected conversational data from 48 students interacting with ChatGPT in a master's level data visualization course over one semester. We then developed a coding scheme, grounded in the literature on cognitive levels and thematic analysis, to categorize students' interaction patterns with ChatGPT. Furthermore, we present a visual analytics system, StuGPTViz, that tracks and compares temporal patterns in student prompts and the quality of ChatGPT's responses at multiple scales, revealing significant pedagogical insights for instructors. We validated the system's effectiveness through expert interviews with six data visualization instructors and three case studies. The results confirmed StuGPTViz's capacity to enhance educators' insights into the pedagogical value of ChatGPT. We also discussed the potential research opportunities of applying visual analytics in education and developing AI-driven personalized learning solutions.
JailbreakHunter: A Visual Analytics Approach for Jailbreak Prompts Discovery from Large-Scale Human-LLM Conversational Datasets
Jul 03, 2024


Abstract:Large Language Models (LLMs) have gained significant attention but also raised concerns due to the risk of misuse. Jailbreak prompts, a popular type of adversarial attack towards LLMs, have appeared and constantly evolved to breach the safety protocols of LLMs. To address this issue, LLMs are regularly updated with safety patches based on reported jailbreak prompts. However, malicious users often keep their successful jailbreak prompts private to exploit LLMs. To uncover these private jailbreak prompts, extensive analysis of large-scale conversational datasets is necessary to identify prompts that still manage to bypass the system's defenses. This task is highly challenging due to the immense volume of conversation data, diverse characteristics of jailbreak prompts, and their presence in complex multi-turn conversations. To tackle these challenges, we introduce JailbreakHunter, a visual analytics approach for identifying jailbreak prompts in large-scale human-LLM conversational datasets. We have designed a workflow with three analysis levels: group-level, conversation-level, and turn-level. Group-level analysis enables users to grasp the distribution of conversations and identify suspicious conversations using multiple criteria, such as similarity with reported jailbreak prompts in previous research and attack success rates. Conversation-level analysis facilitates the understanding of the progress of conversations and helps discover jailbreak prompts within their conversation contexts. Turn-level analysis allows users to explore the semantic similarity and token overlap between a singleturn prompt and the reported jailbreak prompts, aiding in the identification of new jailbreak strategies. The effectiveness and usability of the system were verified through multiple case studies and expert interviews.
 Add to Chrome
 Add to Firefox
 Add to Edge