Yuxin Ma
MAR: Efficient Large Language Models via Module-aware Architecture Refinement
Jan 29, 2026Abstract:Large Language Models (LLMs) excel across diverse domains but suffer from high energy costs due to quadratic attention and dense Feed-Forward Network (FFN) operations. To address these issues, we propose Module-aware Architecture Refinement (MAR), a two-stage framework that integrates State Space Models (SSMs) for linear-time sequence modeling and applies activation sparsification to reduce FFN costs. In addition, to mitigate low information density and temporal mismatch in integrating Spiking Neural Networks (SNNs) with SSMs, we design the Adaptive Ternary Multi-step Neuron (ATMN) and the Spike-aware Bidirectional Distillation Strategy (SBDS). Extensive experiments demonstrate that MAR effectively restores the performance of its dense counterpart under constrained resources while substantially reducing inference energy consumption. Furthermore, it outperforms efficient models of comparable or even larger scale, underscoring its potential for building efficient and practical LLMs.
Hebbian Learning with Global Direction
Jan 29, 2026Abstract:Backpropagation algorithm has driven the remarkable success of deep neural networks, but its lack of biological plausibility and high computational costs have motivated the ongoing search for alternative training methods. Hebbian learning has attracted considerable interest as a biologically plausible alternative to backpropagation. Nevertheless, its exclusive reliance on local information, without consideration of global task objectives, fundamentally limits its scalability. Inspired by the biological synergy between neuromodulators and local plasticity, we introduce a novel model-agnostic Global-guided Hebbian Learning (GHL) framework, which seamlessly integrates local and global information to scale up across diverse networks and tasks. In specific, the local component employs Oja's rule with competitive learning to ensure stable and effective local updates. Meanwhile, the global component introduces a sign-based signal that guides the direction of local Hebbian plasticity updates. Extensive experiments demonstrate that our method consistently outperforms existing Hebbian approaches. Notably, on large-scale network and complex datasets like ImageNet, our framework achieves the competitive results and significantly narrows the gap with standard backpropagation.
LLaDA2.0: Scaling Up Diffusion Language Models to 100B
Dec 24, 2025Abstract:This paper presents LLaDA2.0 -- a tuple of discrete diffusion large language models (dLLM) scaling up to 100B total parameters through systematic conversion from auto-regressive (AR) models -- establishing a new paradigm for frontier-scale deployment. Instead of costly training from scratch, LLaDA2.0 upholds knowledge inheritance, progressive adaption and efficiency-aware design principle, and seamless converts a pre-trained AR model into dLLM with a novel 3-phase block-level WSD based training scheme: progressive increasing block-size in block diffusion (warm-up), large-scale full-sequence diffusion (stable) and reverting back to compact-size block diffusion (decay). Along with post-training alignment with SFT and DPO, we obtain LLaDA2.0-mini (16B) and LLaDA2.0-flash (100B), two instruction-tuned Mixture-of-Experts (MoE) variants optimized for practical deployment. By preserving the advantages of parallel decoding, these models deliver superior performance and efficiency at the frontier scale. Both models were open-sourced.
VisMoDAl: Visual Analytics for Evaluating and Improving Corruption Robustness of Vision-Language Models
Sep 18, 2025Abstract:Vision-language (VL) models have shown transformative potential across various critical domains due to their capability to comprehend multi-modal information. However, their performance frequently degrades under distribution shifts, making it crucial to assess and improve robustness against real-world data corruption encountered in practical applications. While advancements in VL benchmark datasets and data augmentation (DA) have contributed to robustness evaluation and improvement, there remain challenges due to a lack of in-depth comprehension of model behavior as well as the need for expertise and iterative efforts to explore data patterns. Given the achievement of visualization in explaining complex models and exploring large-scale data, understanding the impact of various data corruption on VL models aligns naturally with a visual analytics approach. To address these challenges, we introduce VisMoDAl, a visual analytics framework designed to evaluate VL model robustness against various corruption types and identify underperformed samples to guide the development of effective DA strategies. Grounded in the literature review and expert discussions, VisMoDAl supports multi-level analysis, ranging from examining performance under specific corruptions to task-driven inspection of model behavior and corresponding data slice. Unlike conventional works, VisMoDAl enables users to reason about the effects of corruption on VL models, facilitating both model behavior understanding and DA strategy formulation. The utility of our system is demonstrated through case studies and quantitative evaluations focused on corruption robustness in the image captioning task.
NeurIPS 2024 ML4CFD Competition: Results and Retrospective Analysis
Jun 10, 2025Abstract:The integration of machine learning (ML) into the physical sciences is reshaping computational paradigms, offering the potential to accelerate demanding simulations such as computational fluid dynamics (CFD). Yet, persistent challenges in accuracy, generalization, and physical consistency hinder the practical deployment of ML models in scientific domains. To address these limitations and systematically benchmark progress, we organized the ML4CFD competition, centered on surrogate modeling for aerodynamic simulations over two-dimensional airfoils. The competition attracted over 240 teams, who were provided with a curated dataset generated via OpenFOAM and evaluated through a multi-criteria framework encompassing predictive accuracy, physical fidelity, computational efficiency, and out-of-distribution generalization. This retrospective analysis reviews the competition outcomes, highlighting several approaches that outperformed baselines under our global evaluation score. Notably, the top entry exceeded the performance of the original OpenFOAM solver on aggregate metrics, illustrating the promise of ML-based surrogates to outperform traditional solvers under tailored criteria. Drawing from these results, we analyze the key design principles of top submissions, assess the robustness of our evaluation framework, and offer guidance for future scientific ML challenges.
On Transferring Transferability: Towards a Theory for Size Generalization
May 29, 2025Abstract:Many modern learning tasks require models that can take inputs of varying sizes. Consequently, dimension-independent architectures have been proposed for domains where the inputs are graphs, sets, and point clouds. Recent work on graph neural networks has explored whether a model trained on low-dimensional data can transfer its performance to higher-dimensional inputs. We extend this body of work by introducing a general framework for transferability across dimensions. We show that transferability corresponds precisely to continuity in a limit space formed by identifying small problem instances with equivalent large ones. This identification is driven by the data and the learning task. We instantiate our framework on existing architectures, and implement the necessary changes to ensure their transferability. Finally, we provide design principles for designing new transferable models. Numerical experiments support our findings.
Nonlinear Laplacians: Tunable principal component analysis under directional prior information
May 18, 2025Abstract:We introduce a new family of algorithms for detecting and estimating a rank-one signal from a noisy observation under prior information about that signal's direction, focusing on examples where the signal is known to have entries biased to be positive. Given a matrix observation $\mathbf{Y}$, our algorithms construct a nonlinear Laplacian, another matrix of the form $\mathbf{Y} + \mathrm{diag}(\sigma(\mathbf{Y}\mathbf{1}))$ for a nonlinear $\sigma: \mathbb{R} \to \mathbb{R}$, and examine the top eigenvalue and eigenvector of this matrix. When $\mathbf{Y}$ is the (suitably normalized) adjacency matrix of a graph, our approach gives a class of algorithms that search for unusually dense subgraphs by computing a spectrum of the graph "deformed" by the degree profile $\mathbf{Y}\mathbf{1}$. We study the performance of such algorithms compared to direct spectral algorithms (the case $\sigma = 0$) on models of sparse principal component analysis with biased signals, including the Gaussian planted submatrix problem. For such models, we rigorously characterize the critical threshold strength of rank-one signal, as a function of the nonlinearity $\sigma$, at which an outlier eigenvalue appears in the spectrum of a nonlinear Laplacian. While identifying the $\sigma$ that minimizes this critical signal strength in closed form seems intractable, we explore three approaches to design $\sigma$ numerically: exhaustively searching over simple classes of $\sigma$, learning $\sigma$ from datasets of problem instances, and tuning $\sigma$ using black-box optimization of the critical signal strength. We find both theoretically and empirically that, if $\sigma$ is chosen appropriately, then nonlinear Laplacian spectral algorithms substantially outperform direct spectral algorithms, while avoiding the complexity of broader classes of algorithms like approximate message passing or general first order methods.
Threshold Modulation for Online Test-Time Adaptation of Spiking Neural Networks
May 08, 2025


Abstract:Recently, spiking neural networks (SNNs), deployed on neuromorphic chips, provide highly efficient solutions on edge devices in different scenarios. However, their ability to adapt to distribution shifts after deployment has become a crucial challenge. Online test-time adaptation (OTTA) offers a promising solution by enabling models to dynamically adjust to new data distributions without requiring source data or labeled target samples. Nevertheless, existing OTTA methods are largely designed for traditional artificial neural networks and are not well-suited for SNNs. To address this gap, we propose a low-power, neuromorphic chip-friendly online test-time adaptation framework, aiming to enhance model generalization under distribution shifts. The proposed approach is called Threshold Modulation (TM), which dynamically adjusts the firing threshold through neuronal dynamics-inspired normalization, being more compatible with neuromorphic hardware. Experimental results on benchmark datasets demonstrate the effectiveness of this method in improving the robustness of SNNs against distribution shifts while maintaining low computational cost. The proposed method offers a practical solution for online test-time adaptation of SNNs, providing inspiration for the design of future neuromorphic chips. The demo code is available at github.com/NneurotransmitterR/TM-OTTA-SNN.
Decouple to Reconstruct: High Quality UHD Restoration via Active Feature Disentanglement and Reversible Fusion
Mar 17, 2025


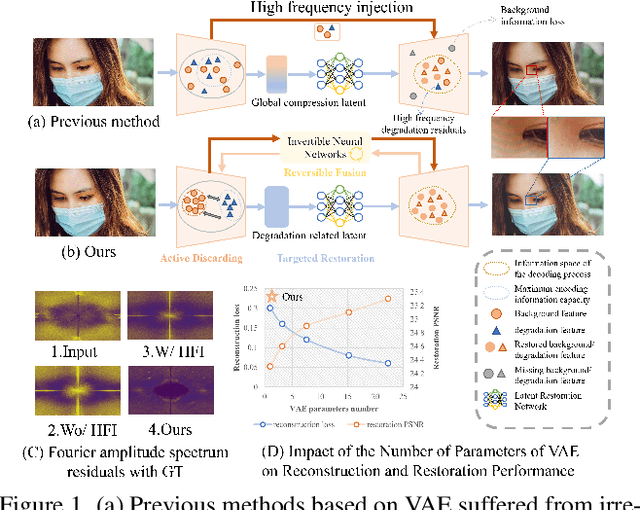
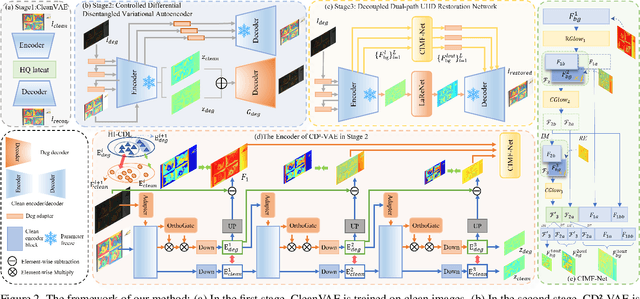
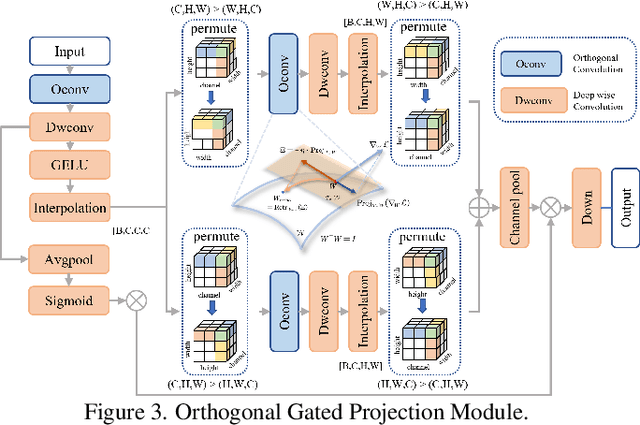
Abstract:Ultra-high-definition (UHD) image restoration often faces computational bottlenecks and information loss due to its extremely high resolution. Existing studies based on Variational Autoencoders (VAE) improve efficiency by transferring the image restoration process from pixel space to latent space. However, degraded components are inherently coupled with background elements in degraded images, both information loss during compression and information gain during compensation remain uncontrollable. These lead to restored images often exhibiting image detail loss and incomplete degradation removal. To address this issue, we propose a Controlled Differential Disentangled VAE, which utilizes Hierarchical Contrastive Disentanglement Learning and an Orthogonal Gated Projection Module to guide the VAE to actively discard easily recoverable background information while encoding more difficult-to-recover degraded information into the latent space. Additionally, we design a Complex Invertible Multiscale Fusion Network to handle background features, ensuring their consistency, and utilize a latent space restoration network to transform the degraded latent features, leading to more accurate restoration results. Extensive experimental results demonstrate that our method effectively alleviates the information loss problem in VAE models while ensuring computational efficiency, significantly improving the quality of UHD image restoration, and achieves state-of-the-art results in six UHD restoration tasks with only 1M parameters.
ParetoLens: A Visual Analytics Framework for Exploring Solution Sets of Multi-objective Evolutionary Algorithms
Jan 06, 2025Abstract:In the domain of multi-objective optimization, evolutionary algorithms are distinguished by their capability to generate a diverse population of solutions that navigate the trade-offs inherent among competing objectives. This has catalyzed the ascension of evolutionary multi-objective optimization (EMO) as a prevalent approach. Despite the effectiveness of the EMO paradigm, the analysis of resultant solution sets presents considerable challenges. This is primarily attributed to the high-dimensional nature of the data and the constraints imposed by static visualization methods, which frequently culminate in visual clutter and impede interactive exploratory analysis. To address these challenges, this paper introduces ParetoLens, a visual analytics framework specifically tailored to enhance the inspection and exploration of solution sets derived from the multi-objective evolutionary algorithms. Utilizing a modularized, algorithm-agnostic design, ParetoLens enables a detailed inspection of solution distributions in both decision and objective spaces through a suite of interactive visual representations. This approach not only mitigates the issues associated with static visualizations but also supports a more nuanced and flexible analysis process. The usability of the framework is evaluated through case studies and expert interviews, demonstrating its potential to uncover complex patterns and facilitate a deeper understanding of multi-objective optimization solution sets. A demo website of ParetoLens is available at https://dva-lab.org/paretolens/.
 Add to Chrome
 Add to Firefox
 Add to Edge