Zezheng Feng
DiagLink: A Dual-User Diagnostic Assistance System by Synergizing Experts with LLMs and Knowledge Graphs
Jan 28, 2026Abstract:The global shortage and uneven distribution of medical expertise continue to hinder equitable access to accurate diagnostic care. While existing intelligent diagnostic system have shown promise, most struggle with dual-user interaction, and dynamic knowledge integration -- limiting their real-world applicability. In this study, we present DiagLink, a dual-user diagnostic assistance system that synergizes large language models (LLMs), knowledge graphs (KGs), and medical experts to support both patients and physicians. DiagLink uses guided dialogues to elicit patient histories, leverages LLMs and KGs for collaborative reasoning, and incorporates physician oversight for continuous knowledge validation and evolution. The system provides a role-adaptive interface, dynamically visualized history, and unified multi-source evidence to improve both trust and usability. We evaluate DiagLink through user study, use cases and expert interviews, demonstrating its effectiveness in improving user satisfaction and diagnostic efficiency, while offering insights for the design of future AI-assisted diagnostic systems.
TrafPS: A Shapley-based Visual Analytics Approach to Interpret Traffic
Mar 07, 2024


Abstract:Recent achievements in deep learning (DL) have shown its potential for predicting traffic flows. Such predictions are beneficial for understanding the situation and making decisions in traffic control. However, most state-of-the-art DL models are considered "black boxes" with little to no transparency for end users with respect to the underlying mechanisms. Some previous work tried to "open the black boxes" and increase the interpretability of how predictions are generated. However, it still remains challenging to handle complex models on large-scale spatio-temporal data and discover salient spatial and temporal patterns that significantly influence traffic flows. To overcome the challenges, we present TrafPS, a visual analytics approach for interpreting traffic prediction outcomes to support decision-making in traffic management and urban planning. The measurements, region SHAP and trajectory SHAP, are proposed to quantify the impact of flow patterns on urban traffic at different levels. Based on the task requirement from the domain experts, we employ an interactive visual interface for multi-aspect exploration and analysis of significant flow patterns. Two real-world case studies demonstrate the effectiveness of TrafPS in identifying key routes and decision-making support for urban planning.
TrafPS: A Visual Analysis System Interpreting Traffic Prediction in Shapley
Mar 11, 2022


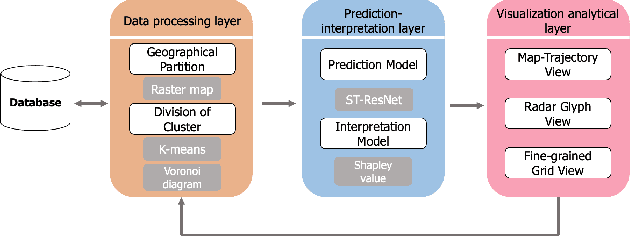
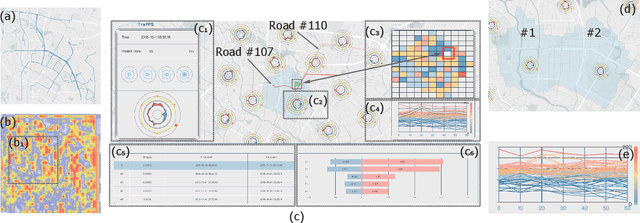
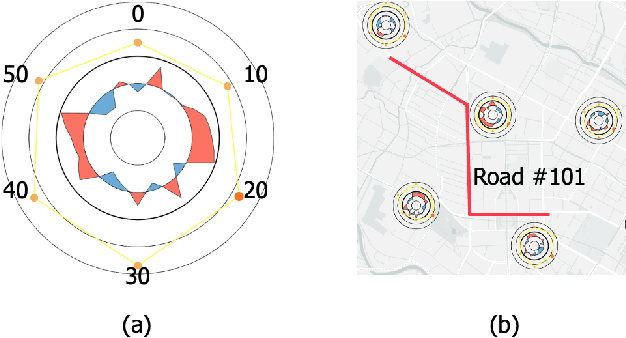
Abstract:In recent years, deep learning approaches have been proved good performance in traffic flow prediction, many complex models have been proposed to make traffic flow prediction more accurate. However, lacking transparency limits the domain experts on understanding when and where the input data mainly impact the results. Most urban experts and planners can only adjust traffic based on their own experience and can not react effectively toward the potential traffic jam. To tackle this problem, we adapt Shapley value and present a visualization analysis system , which can provide experts with the interpretation of traffic flow prediction. TrafPS consists of three layers, from data process to results computation and visualization. We design three visualization views in TrafPS to support the prediction analysis process. One demonstration shows that the TrafPS supports an effective analytical pipeline on interpreting the prediction flow to users and provides an intuitive visualization for decision making.
 Add to Chrome
 Add to Firefox
 Add to Edge