Furui Cheng
Interactive Analysis of LLMs using Meaningful Counterfactuals
Apr 23, 2024Abstract:Counterfactual examples are useful for exploring the decision boundaries of machine learning models and determining feature attributions. How can we apply counterfactual-based methods to analyze and explain LLMs? We identify the following key challenges. First, the generated textual counterfactuals should be meaningful and readable to users and thus can be mentally compared to draw conclusions. Second, to make the solution scalable to long-form text, users should be equipped with tools to create batches of counterfactuals from perturbations at various granularity levels and interactively analyze the results. In this paper, we tackle the above challenges and contribute 1) a novel algorithm for generating batches of complete and meaningful textual counterfactuals by removing and replacing text segments in different granularities, and 2) LLM Analyzer, an interactive visualization tool to help users understand an LLM's behaviors by interactively inspecting and aggregating meaningful counterfactuals. We evaluate the proposed algorithm by the grammatical correctness of its generated counterfactuals using 1,000 samples from medical, legal, finance, education, and news datasets. In our experiments, 97.2% of the counterfactuals are grammatically correct. Through a use case, user studies, and feedback from experts, we demonstrate the usefulness and usability of the proposed interactive visualization tool.
RELIC: Investigating Large Language Model Responses using Self-Consistency
Nov 28, 2023
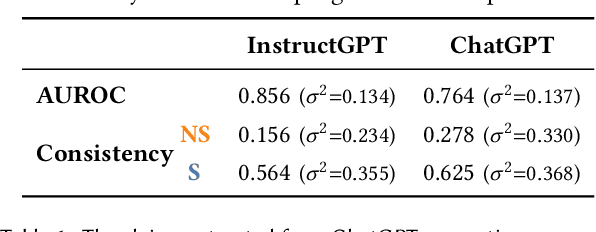

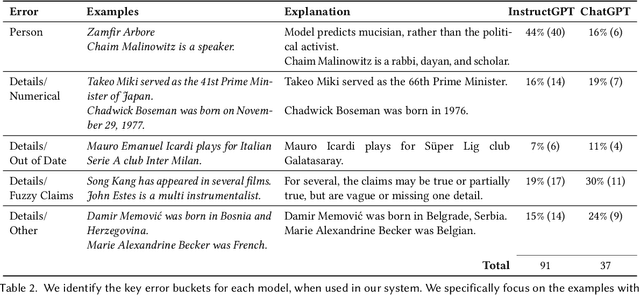
Abstract:Large Language Models (LLMs) are notorious for blending fact with fiction and generating non-factual content, known as hallucinations. To tackle this challenge, we propose an interactive system that helps users obtain insights into the reliability of the generated text. Our approach is based on the idea that the self-consistency of multiple samples generated by the same LLM relates to its confidence in individual claims in the generated texts. Using this idea, we design RELIC, an interactive system that enables users to investigate and verify semantic-level variations in multiple long-form responses. This allows users to recognize potentially inaccurate information in the generated text and make necessary corrections. From a user study with ten participants, we demonstrate that our approach helps users better verify the reliability of the generated text. We further summarize the design implications and lessons learned from this research for inspiring future studies on reliable human-LLM interactions.
ShortcutLens: A Visual Analytics Approach for Exploring Shortcuts in Natural Language Understanding Dataset
Aug 17, 2022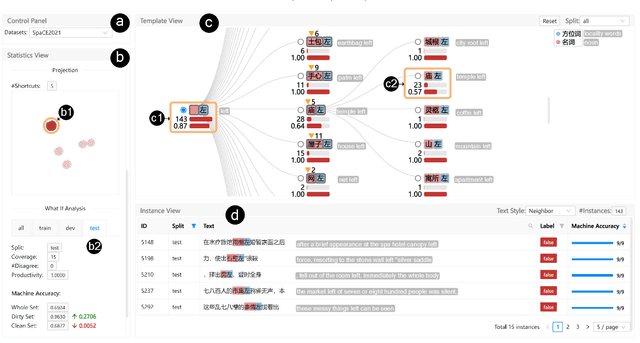

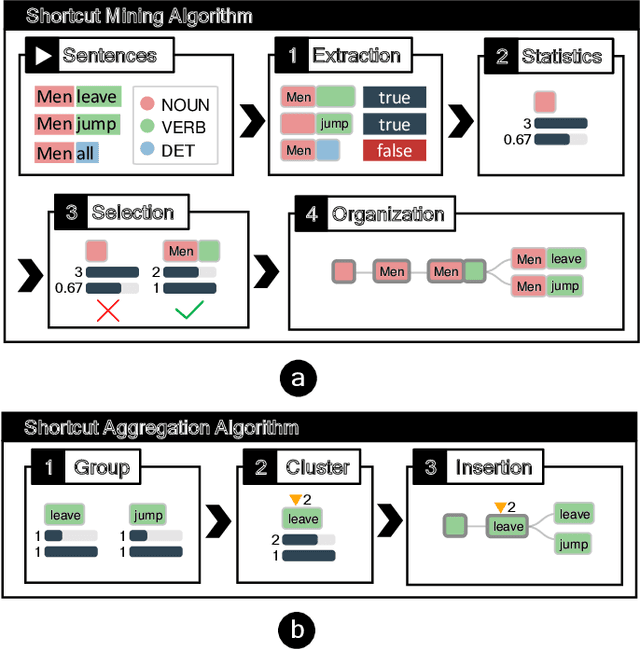
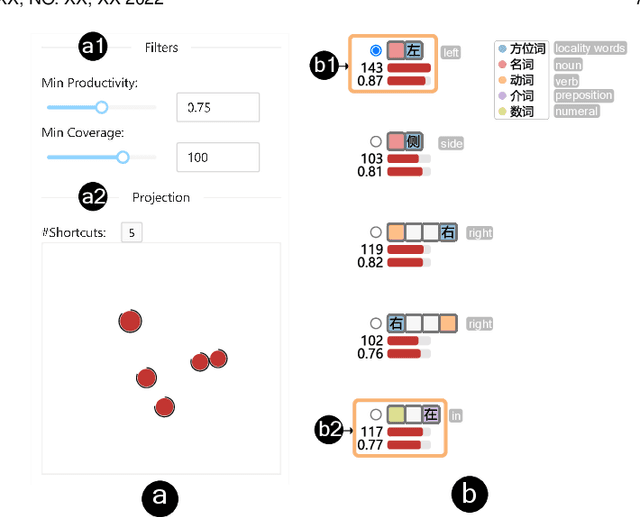
Abstract:Benchmark datasets play an important role in evaluating Natural Language Understanding (NLU) models. However, shortcuts -- unwanted biases in the benchmark datasets -- can damage the effectiveness of benchmark datasets in revealing models' real capabilities. Since shortcuts vary in coverage, productivity, and semantic meaning, it is challenging for NLU experts to systematically understand and avoid them when creating benchmark datasets. In this paper, we develop a visual analytics system, ShortcutLens, to help NLU experts explore shortcuts in NLU benchmark datasets. The system allows users to conduct multi-level exploration of shortcuts. Specifically, Statistics View helps users grasp the statistics such as coverage and productivity of shortcuts in the benchmark dataset. Template View employs hierarchical and interpretable templates to summarize different types of shortcuts. Instance View allows users to check the corresponding instances covered by the shortcuts. We conduct case studies and expert interviews to evaluate the effectiveness and usability of the system. The results demonstrate that ShortcutLens supports users in gaining a better understanding of benchmark dataset issues through shortcuts, inspiring them to create challenging and pertinent benchmark datasets.
Interactive Data Analysis with Next-step Natural Language Query Recommendation
Jan 13, 2022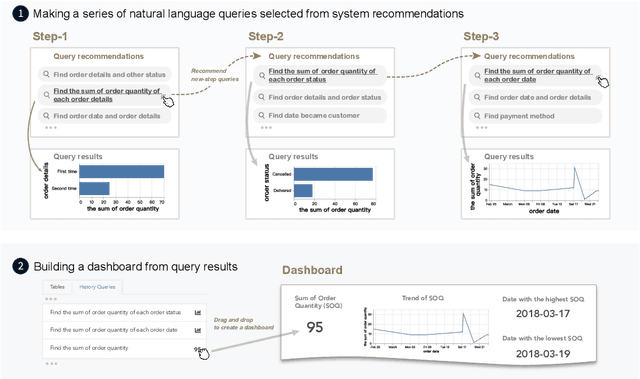
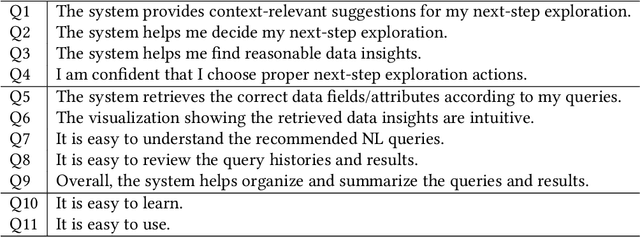
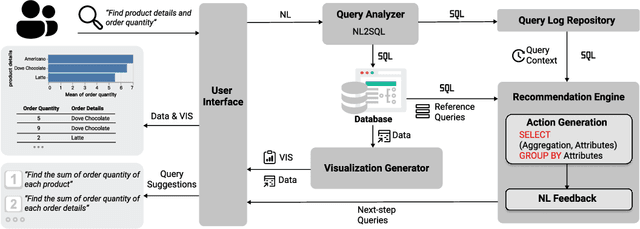

Abstract:Natural language interfaces (NLIs) provide users with a convenient way to interactively analyze data through natural language queries. Nevertheless, interactive data analysis is a demanding process, especially for novice data analysts. When exploring large and complex datasets from different domains, data analysts do not necessarily have sufficient knowledge about data and application domains. It makes them unable to efficiently elicit a series of queries and extensively derive desirable data insights. In this paper, we develop an NLI with a step-wise query recommendation module to assist users in choosing appropriate next-step exploration actions. The system adopts a data-driven approach to generate step-wise semantically relevant and context-aware query suggestions for application domains of users' interest based on their query logs. Also, the system helps users organize query histories and results into a dashboard to communicate the discovered data insights. With a comparative user study, we show that our system can facilitate a more effective and systematic data analysis process than a baseline without the recommendation module.
VBridge: Connecting the Dots Between Features, Explanations, and Data for Healthcare Models
Aug 04, 2021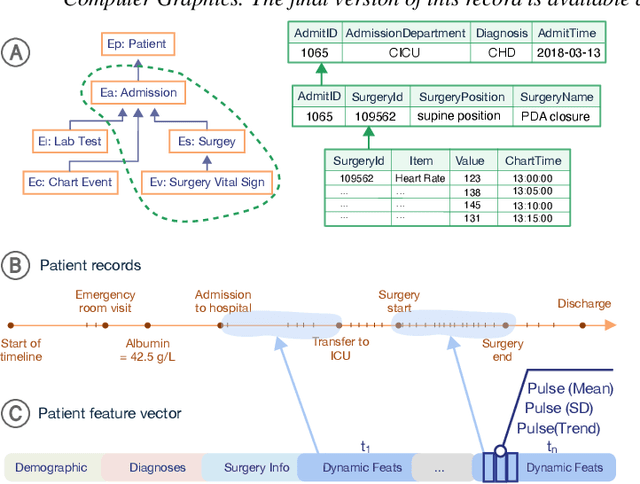
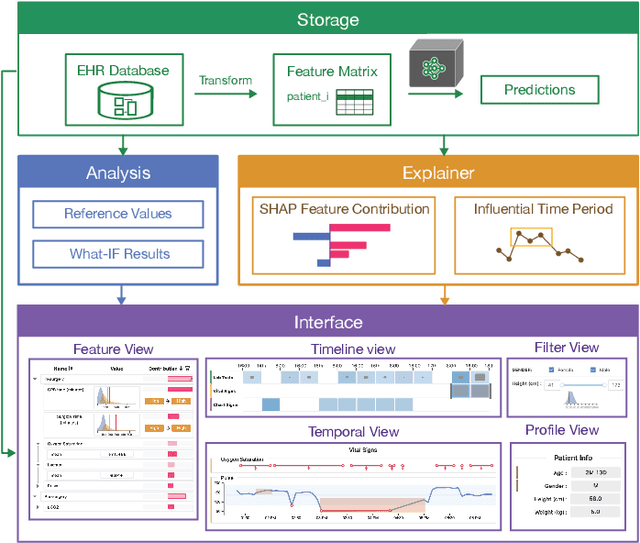
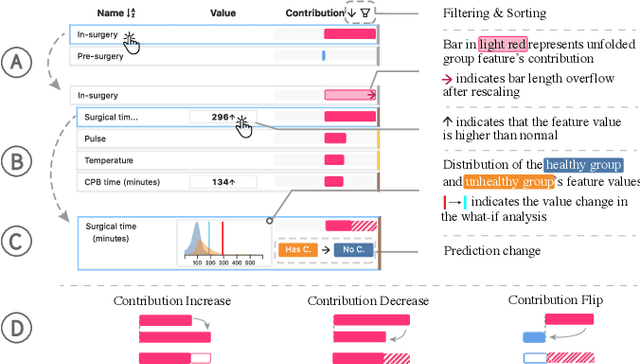
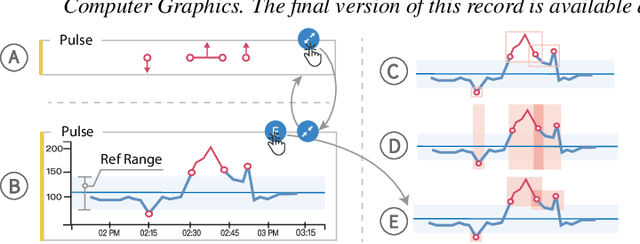
Abstract:Machine learning (ML) is increasingly applied to Electronic Health Records (EHRs) to solve clinical prediction tasks. Although many ML models perform promisingly, issues with model transparency and interpretability limit their adoption in clinical practice. Directly using existing explainable ML techniques in clinical settings can be challenging. Through literature surveys and collaborations with six clinicians with an average of 17 years of clinical experience, we identified three key challenges, including clinicians' unfamiliarity with ML features, lack of contextual information, and the need for cohort-level evidence. Following an iterative design process, we further designed and developed VBridge, a visual analytics tool that seamlessly incorporates ML explanations into clinicians' decision-making workflow. The system includes a novel hierarchical display of contribution-based feature explanations and enriched interactions that connect the dots between ML features, explanations, and data. We demonstrated the effectiveness of VBridge through two case studies and expert interviews with four clinicians, showing that visually associating model explanations with patients' situational records can help clinicians better interpret and use model predictions when making clinician decisions. We further derived a list of design implications for developing future explainable ML tools to support clinical decision-making.
DECE: Decision Explorer with Counterfactual Explanations for Machine Learning Models
Aug 19, 2020
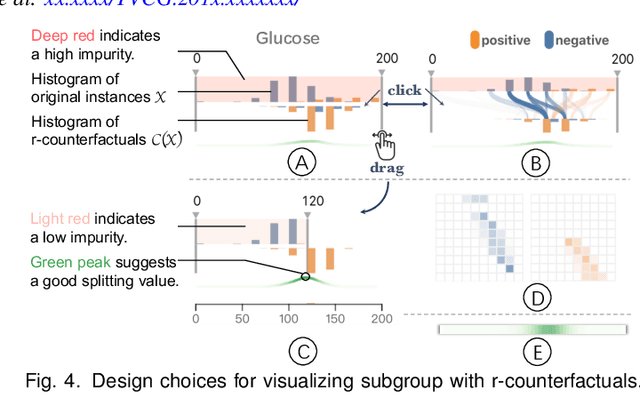
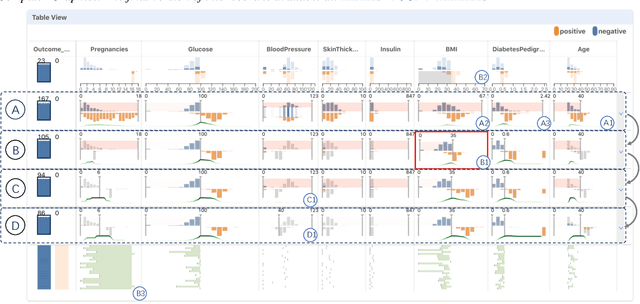
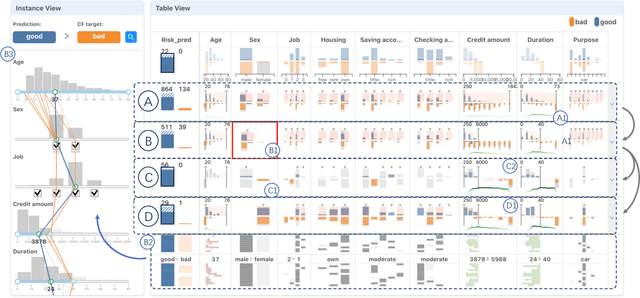
Abstract:With machine learning models being increasingly applied to various decision-making scenarios, people have spent growing efforts to make machine learning models more transparent and explainable. Among various explanation techniques, counterfactual explanations have the advantages of being human-friendly and actionable -- a counterfactual explanation tells the user how to gain the desired prediction with minimal changes to the input. Besides, counterfactual explanations can also serve as efficient probes to the models' decisions. In this work, we exploit the potential of counterfactual explanations to understand and explore the behavior of machine learning models. We design DECE, an interactive visualization system that helps understand and explore a model's decisions on individual instances and data subsets, supporting users ranging from decision-subjects to model developers. DECE supports exploratory analysis of model decisions by combining the strengths of counterfactual explanations at instance- and subgroup-levels. We also introduce a set of interactions that enable users to customize the generation of counterfactual explanations to find more actionable ones that can suit their needs. Through three use cases and an expert interview, we demonstrate the effectiveness of DECE in supporting decision exploration tasks and instance explanations.
 Add to Chrome
 Add to Firefox
 Add to Edge