Yao Ming
A Scalable Matrix Visualization for Understanding Tree Ensemble Classifiers
Sep 05, 2024


Abstract:The high performance of tree ensemble classifiers benefits from a large set of rules, which, in turn, makes the models hard to understand. To improve interpretability, existing methods extract a subset of rules for approximation using model reduction techniques. However, by focusing on the reduced rule set, these methods often lose fidelity and ignore anomalous rules that, despite their infrequency, play crucial roles in real-world applications. This paper introduces a scalable visual analysis method to explain tree ensemble classifiers that contain tens of thousands of rules. The key idea is to address the issue of losing fidelity by adaptively organizing the rules as a hierarchy rather than reducing them. To ensure the inclusion of anomalous rules, we develop an anomaly-biased model reduction method to prioritize these rules at each hierarchical level. Synergized with this hierarchical organization of rules, we develop a matrix-based hierarchical visualization to support exploration at different levels of detail. Our quantitative experiments and case studies demonstrate how our method fosters a deeper understanding of both common and anomalous rules, thereby enhancing interpretability without sacrificing comprehensiveness.
Sequentially Controlled Text Generation
Jan 05, 2023


Abstract:While GPT-2 generates sentences that are remarkably human-like, longer documents can ramble and do not follow human-like writing structure. We study the problem of imposing structure on long-range text. We propose a novel controlled text generation task, sequentially controlled text generation, and identify a dataset, NewsDiscourse as a starting point for this task. We develop a sequential controlled text generation pipeline with generation and editing. We test different degrees of structural awareness and show that, in general, more structural awareness results in higher control-accuracy, grammaticality, coherency and topicality, approaching human-level writing performance.
* 19 pages. 10 pages main body, 3 pages references, 6 pages appendix
DeHumor: Visual Analytics for Decomposing Humor
Jul 18, 2021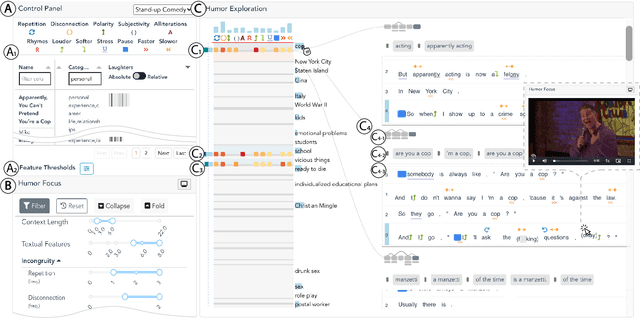
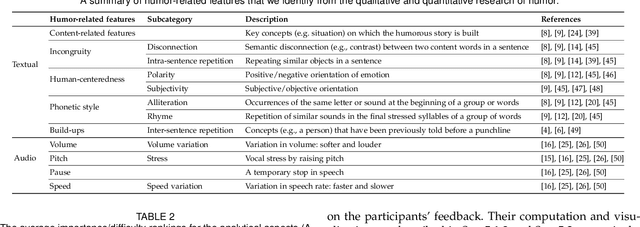


Abstract:Despite being a critical communication skill, grasping humor is challenging -- a successful use of humor requires a mixture of both engaging content build-up and an appropriate vocal delivery (e.g., pause). Prior studies on computational humor emphasize the textual and audio features immediately next to the punchline, yet overlooking longer-term context setup. Moreover, the theories are usually too abstract for understanding each concrete humor snippet. To fill in the gap, we develop DeHumor, a visual analytical system for analyzing humorous behaviors in public speaking. To intuitively reveal the building blocks of each concrete example, DeHumor decomposes each humorous video into multimodal features and provides inline annotations of them on the video script. In particular, to better capture the build-ups, we introduce content repetition as a complement to features introduced in theories of computational humor and visualize them in a context linking graph. To help users locate the punchlines that have the desired features to learn, we summarize the content (with keywords) and humor feature statistics on an augmented time matrix. With case studies on stand-up comedy shows and TED talks, we show that DeHumor is able to highlight various building blocks of humor examples. In addition, expert interviews with communication coaches and humor researchers demonstrate the effectiveness of DeHumor for multimodal humor analysis of speech content and vocal delivery.
GNNVis: A Visual Analytics Approach for Prediction Error Diagnosis of Graph Neural Networks
Dec 03, 2020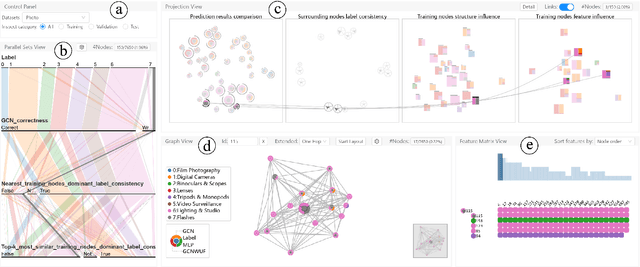
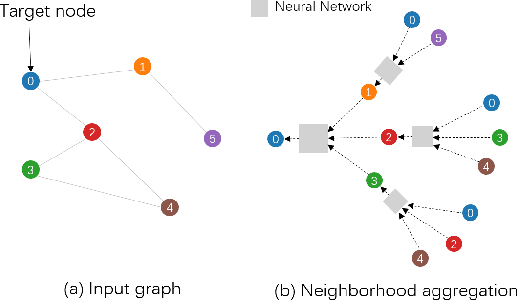
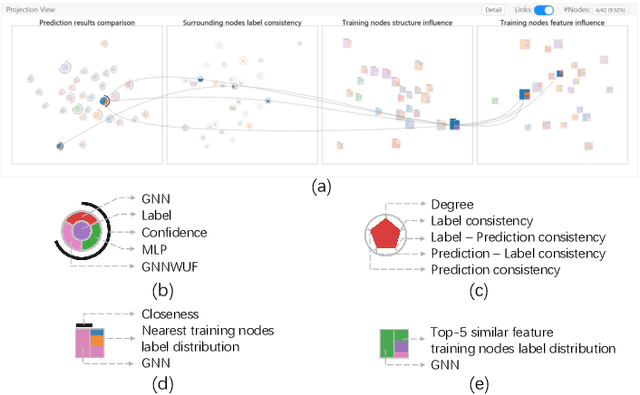
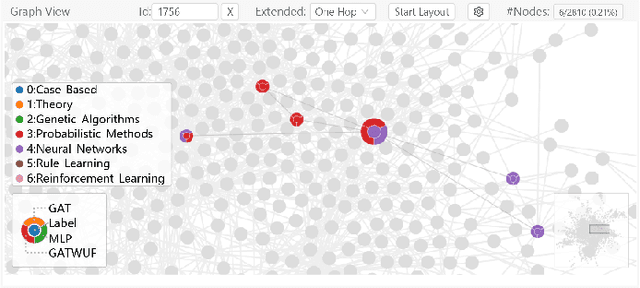
Abstract:Graph Neural Networks (GNNs) aim to extend deep learning techniques to graph data and have achieved significant progress in graph analysis tasks (e.g., node classification) in recent years. However, similar to other deep neural networks like Convolutional Neural Networks (CNNs) and Recurrent Neural Networks (RNNs), GNNs behave like a black box with their details hidden from model developers and users. It is therefore difficult to diagnose possible errors of GNNs. Despite many visual analytics studies being done on CNNs and RNNs, little research has addressed the challenges for GNNs. This paper fills the research gap with an interactive visual analysis tool, GNNVis, to assist model developers and users in understanding and analyzing GNNs. Specifically, Parallel Sets View and Projection View enable users to quickly identify and validate error patterns in the set of wrong predictions; Graph View and Feature Matrix View offer a detailed analysis of individual nodes to assist users in forming hypotheses about the error patterns. Since GNNs jointly model the graph structure and the node features, we reveal the relative influences of the two types of information by comparing the predictions of three models: GNN, Multi-Layer Perceptron (MLP), and GNN Without Using Features (GNNWUF). Two case studies and interviews with domain experts demonstrate the effectiveness of GNNVis in facilitating the understanding of GNN models and their errors.
DECE: Decision Explorer with Counterfactual Explanations for Machine Learning Models
Aug 19, 2020
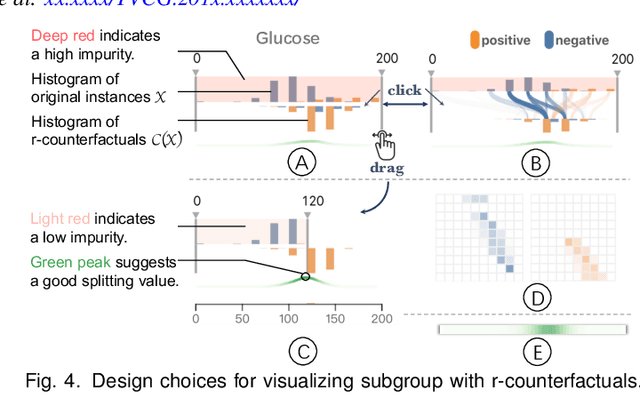
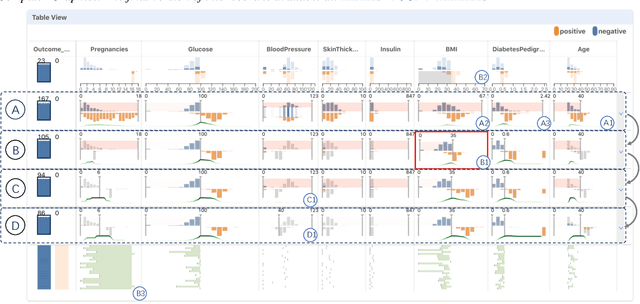
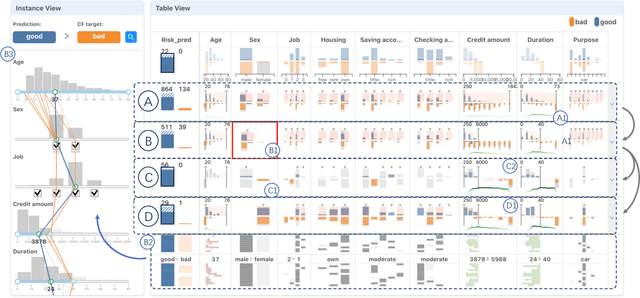
Abstract:With machine learning models being increasingly applied to various decision-making scenarios, people have spent growing efforts to make machine learning models more transparent and explainable. Among various explanation techniques, counterfactual explanations have the advantages of being human-friendly and actionable -- a counterfactual explanation tells the user how to gain the desired prediction with minimal changes to the input. Besides, counterfactual explanations can also serve as efficient probes to the models' decisions. In this work, we exploit the potential of counterfactual explanations to understand and explore the behavior of machine learning models. We design DECE, an interactive visualization system that helps understand and explore a model's decisions on individual instances and data subsets, supporting users ranging from decision-subjects to model developers. DECE supports exploratory analysis of model decisions by combining the strengths of counterfactual explanations at instance- and subgroup-levels. We also introduce a set of interactions that enable users to customize the generation of counterfactual explanations to find more actionable ones that can suit their needs. Through three use cases and an expert interview, we demonstrate the effectiveness of DECE in supporting decision exploration tasks and instance explanations.
Interpretable and Steerable Sequence Learning via Prototypes
Jul 23, 2019


Abstract:One of the major challenges in machine learning nowadays is to provide predictions with not only high accuracy but also user-friendly explanations. Although in recent years we have witnessed increasingly popular use of deep neural networks for sequence modeling, it is still challenging to explain the rationales behind the model outputs, which is essential for building trust and supporting the domain experts to validate, critique and refine the model. We propose ProSeNet, an interpretable and steerable deep sequence model with natural explanations derived from case-based reasoning. The prediction is obtained by comparing the inputs to a few prototypes, which are exemplar cases in the problem domain. For better interpretability, we define several criteria for constructing the prototypes, including simplicity, diversity, and sparsity and propose the learning objective and the optimization procedure. ProSeNet also provides a user-friendly approach to model steering: domain experts without any knowledge on the underlying model or parameters can easily incorporate their intuition and experience by manually refining the prototypes. We conduct experiments on a wide range of real-world applications, including predictive diagnostics for automobiles, ECG, and protein sequence classification and sentiment analysis on texts. The result shows that ProSeNet can achieve accuracy on par with state-of-the-art deep learning models. We also evaluate the interpretability of the results with concrete case studies. Finally, through user study on Amazon Mechanical Turk (MTurk), we demonstrate that the model selects high-quality prototypes which align well with human knowledge and can be interactively refined for better interpretability without loss of performance.
* Accepted as a full paper at KDD 2019 on May 8, 2019
ATMSeer: Increasing Transparency and Controllability in Automated Machine Learning
Feb 13, 2019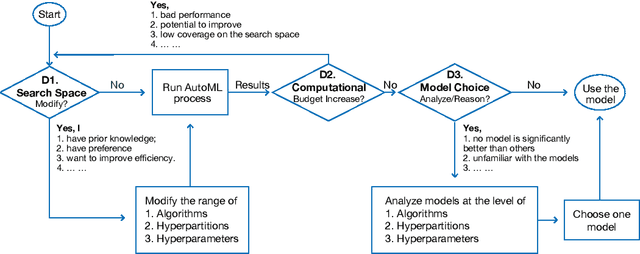
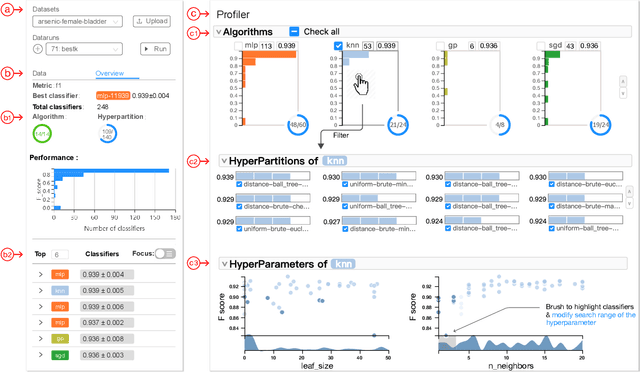
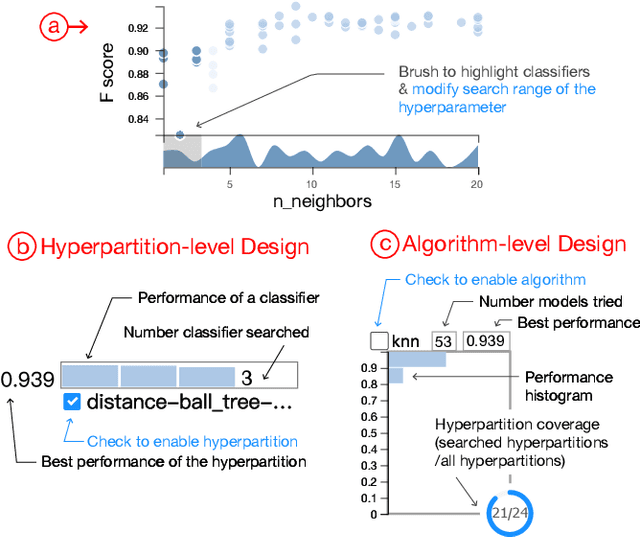
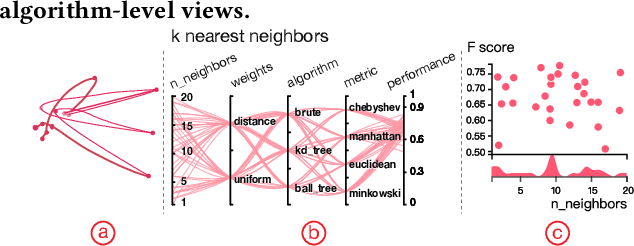
Abstract:To relieve the pain of manually selecting machine learning algorithms and tuning hyperparameters, automated machine learning (AutoML) methods have been developed to automatically search for good models. Due to the huge model search space, it is impossible to try all models. Users tend to distrust automatic results and increase the search budget as much as they can, thereby undermining the efficiency of AutoML. To address these issues, we design and implement ATMSeer, an interactive visualization tool that supports users in refining the search space of AutoML and analyzing the results. To guide the design of ATMSeer, we derive a workflow of using AutoML based on interviews with machine learning experts. A multi-granularity visualization is proposed to enable users to monitor the AutoML process, analyze the searched models, and refine the search space in real time. We demonstrate the utility and usability of ATMSeer through two case studies, expert interviews, and a user study with 13 end users.
RuleMatrix: Visualizing and Understanding Classifiers with Rules
Jul 17, 2018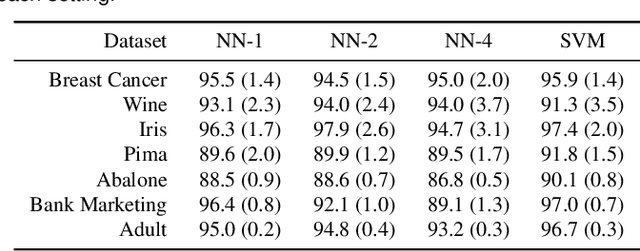

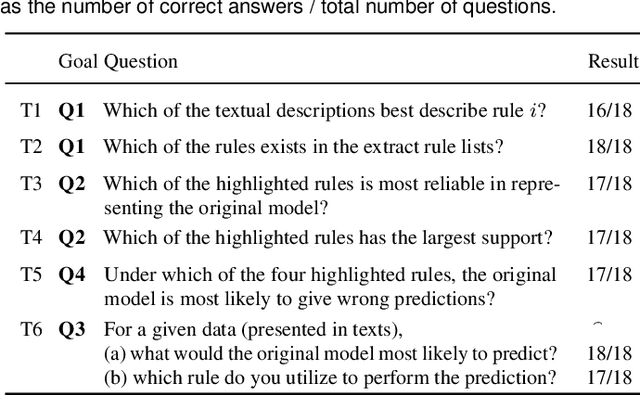
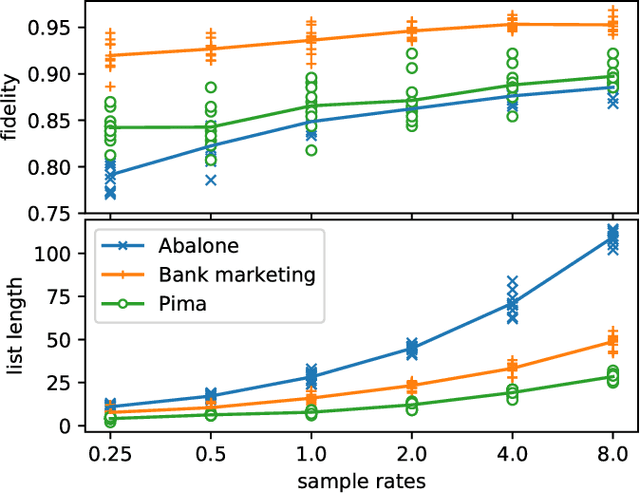
Abstract:With the growing adoption of machine learning techniques, there is a surge of research interest towards making machine learning systems more transparent and interpretable. Various visualizations have been developed to help model developers understand, diagnose, and refine machine learning models. However, a large number of potential but neglected users are the domain experts with little knowledge of machine learning but are expected to work with machine learning systems. In this paper, we present an interactive visualization technique to help users with little expertise in machine learning to understand, explore and validate predictive models. By viewing the model as a black box, we extract a standardized rule-based knowledge representation from its input-output behavior. We design RuleMatrix, a matrix-based visualization of rules to help users navigate and verify the rules and the black-box model. We evaluate the effectiveness of RuleMatrix via two use cases and a usability study.
Understanding Hidden Memories of Recurrent Neural Networks
Oct 30, 2017
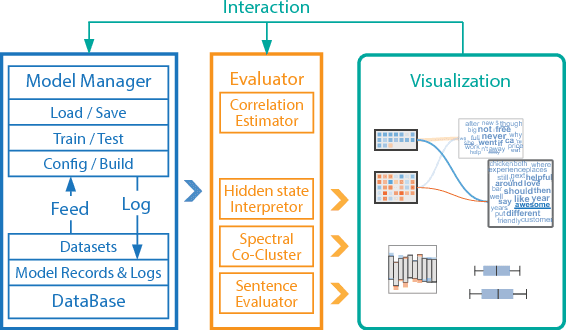
Abstract:Recurrent neural networks (RNNs) have been successfully applied to various natural language processing (NLP) tasks and achieved better results than conventional methods. However, the lack of understanding of the mechanisms behind their effectiveness limits further improvements on their architectures. In this paper, we present a visual analytics method for understanding and comparing RNN models for NLP tasks. We propose a technique to explain the function of individual hidden state units based on their expected response to input texts. We then co-cluster hidden state units and words based on the expected response and visualize co-clustering results as memory chips and word clouds to provide more structured knowledge on RNNs' hidden states. We also propose a glyph-based sequence visualization based on aggregate information to analyze the behavior of an RNN's hidden state at the sentence-level. The usability and effectiveness of our method are demonstrated through case studies and reviews from domain experts.
 Add to Chrome
 Add to Firefox
 Add to Edge