Qianwen Wang
Scaling Unverifiable Rewards: A Case Study on Visual Insights
Dec 27, 2025Abstract:Large Language Model (LLM) agents can increasingly automate complex reasoning through Test-Time Scaling (TTS), iterative refinement guided by reward signals. However, many real-world tasks involve multi-stage pipeline whose final outcomes lack verifiable rewards or sufficient data to train robust reward models, making judge-based refinement prone to accumulate error over stages. We propose Selective TTS, a process-based refinement framework that scales inference across different stages in multi-agent pipeline, instead of repeated refinement over time by prior work. By distributing compute across stages and pruning low-quality branches early using process-specific judges, Selective TTS mitigates the judge drift and stabilizes refinement. Grounded in the data science pipeline, we build an end-to-end multi-agent pipeline for generating visually insightful charts and report of given dataset, and design a reliable LLM-based judge model, aligned with human experts (Kendall's τ=0.55). Our proposed selective TTS then improves insight quality under a fixed compute budget, increasing mean scores from 61.64 to 65.86 while reducing variance. We hope our findings serve as the first step toward to scaling complex, open-ended tasks with unverifiable rewards, such as scientific discovery and story generation.
Stealing Creator's Workflow: A Creator-Inspired Agentic Framework with Iterative Feedback Loop for Improved Scientific Short-form Generation
Apr 26, 2025Abstract:Generating engaging, accurate short-form videos from scientific papers is challenging due to content complexity and the gap between expert authors and readers. Existing end-to-end methods often suffer from factual inaccuracies and visual artifacts, limiting their utility for scientific dissemination. To address these issues, we propose SciTalk, a novel multi-LLM agentic framework, grounding videos in various sources, such as text, figures, visual styles, and avatars. Inspired by content creators' workflows, SciTalk uses specialized agents for content summarization, visual scene planning, and text and layout editing, and incorporates an iterative feedback mechanism where video agents simulate user roles to give feedback on generated videos from previous iterations and refine generation prompts. Experimental evaluations show that SciTalk outperforms simple prompting methods in generating scientifically accurate and engaging content over the refined loop of video generation. Although preliminary results are still not yet matching human creators' quality, our framework provides valuable insights into the challenges and benefits of feedback-driven video generation. Our code, data, and generated videos will be publicly available.
FairytaleCQA: Integrating a Commonsense Knowledge Graph into Children's Storybook Narratives
Nov 16, 2023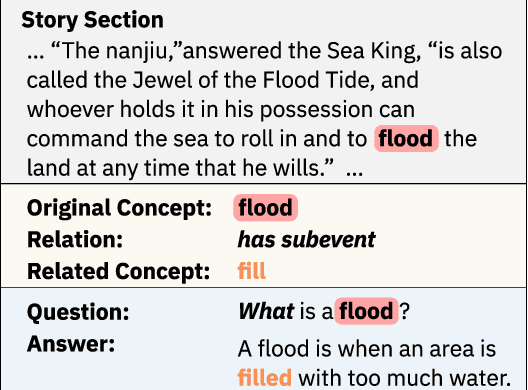

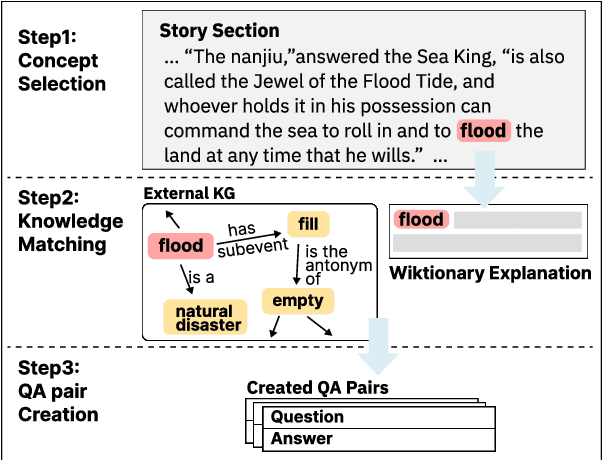
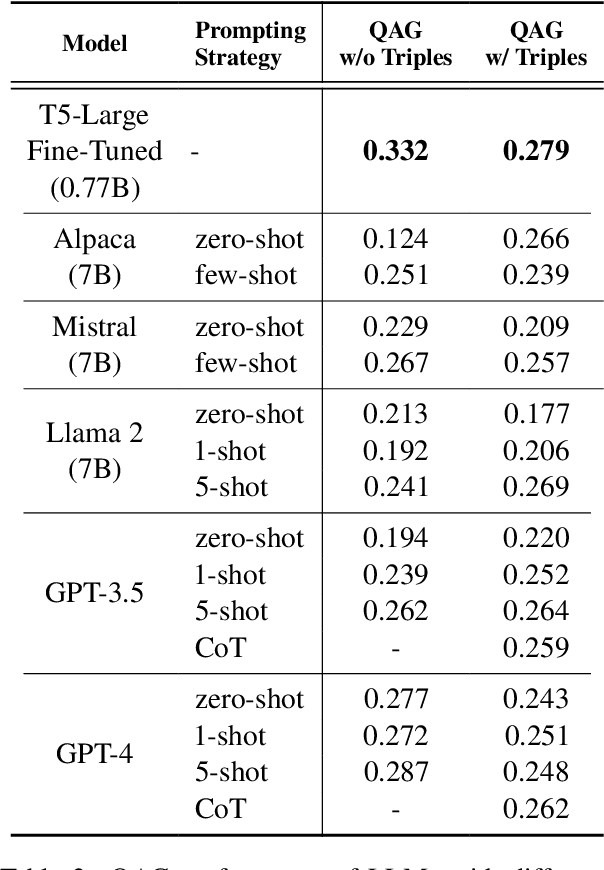
Abstract:AI models (including LLM) often rely on narrative question-answering (QA) datasets to provide customized QA functionalities to support downstream children education applications; however, existing datasets only include QA pairs that are grounded within the given storybook content, but children can learn more when teachers refer the storybook content to real-world knowledge (e.g., commonsense knowledge). We introduce the FairytaleCQA dataset, which is annotated by children education experts, to supplement 278 storybook narratives with educationally appropriate commonsense knowledge. The dataset has 5,868 QA pairs that not only originate from the storybook narrative but also contain the commonsense knowledge grounded by an external knowledge graph (i.e., ConceptNet). A follow-up experiment shows that a smaller model (T5-large) fine-tuned with FairytaleCQA reliably outperforms much larger prompt-engineered LLM (e.g., GPT-4) in this new QA-pair generation task (QAG). This result suggests that: 1) our dataset brings novel challenges to existing LLMs, and 2) human experts' data annotation are still critical as they have much nuanced knowledge that LLMs do not know in the children educational domain.
GNNVis: A Visual Analytics Approach for Prediction Error Diagnosis of Graph Neural Networks
Dec 03, 2020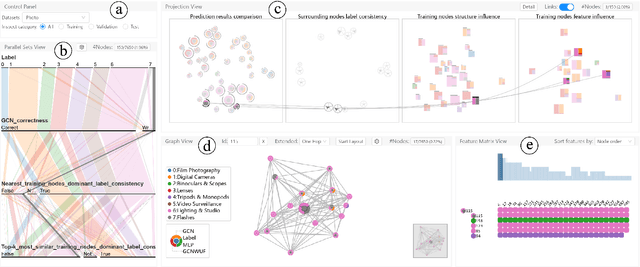
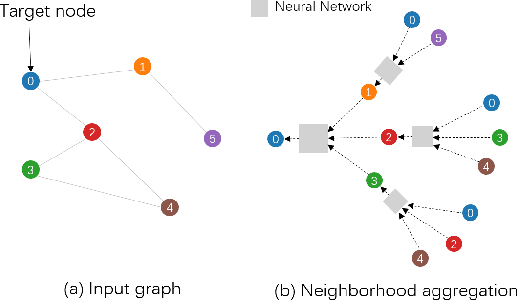
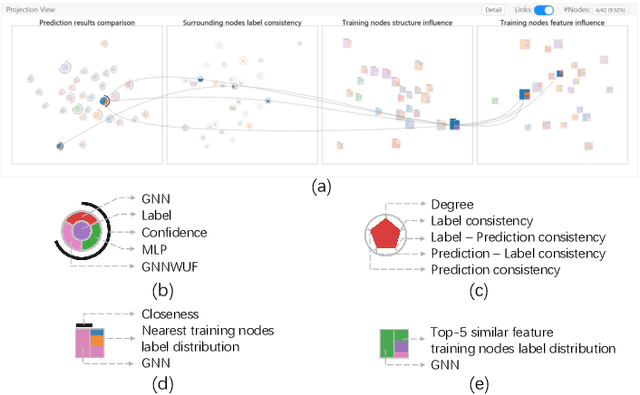
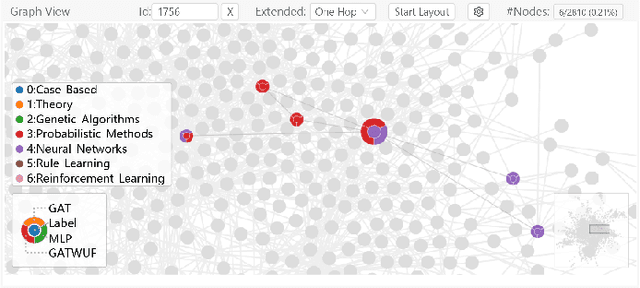
Abstract:Graph Neural Networks (GNNs) aim to extend deep learning techniques to graph data and have achieved significant progress in graph analysis tasks (e.g., node classification) in recent years. However, similar to other deep neural networks like Convolutional Neural Networks (CNNs) and Recurrent Neural Networks (RNNs), GNNs behave like a black box with their details hidden from model developers and users. It is therefore difficult to diagnose possible errors of GNNs. Despite many visual analytics studies being done on CNNs and RNNs, little research has addressed the challenges for GNNs. This paper fills the research gap with an interactive visual analysis tool, GNNVis, to assist model developers and users in understanding and analyzing GNNs. Specifically, Parallel Sets View and Projection View enable users to quickly identify and validate error patterns in the set of wrong predictions; Graph View and Feature Matrix View offer a detailed analysis of individual nodes to assist users in forming hypotheses about the error patterns. Since GNNs jointly model the graph structure and the node features, we reveal the relative influences of the two types of information by comparing the predictions of three models: GNN, Multi-Layer Perceptron (MLP), and GNN Without Using Features (GNNWUF). Two case studies and interviews with domain experts demonstrate the effectiveness of GNNVis in facilitating the understanding of GNN models and their errors.
Visual Analysis of Discrimination in Machine Learning
Jul 30, 2020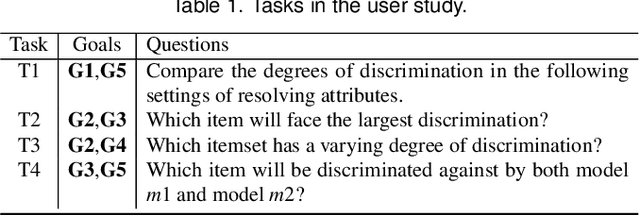
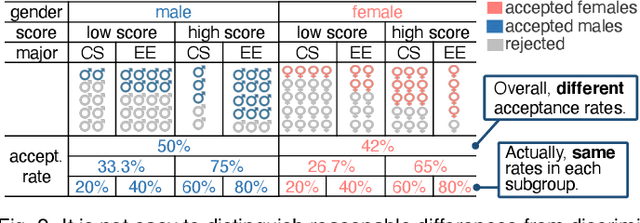
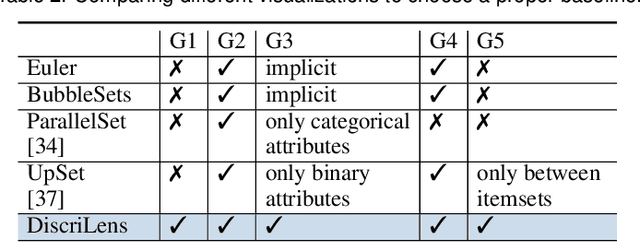

Abstract:The growing use of automated decision-making in critical applications, such as crime prediction and college admission, has raised questions about fairness in machine learning. How can we decide whether different treatments are reasonable or discriminatory? In this paper, we investigate discrimination in machine learning from a visual analytics perspective and propose an interactive visualization tool, DiscriLens, to support a more comprehensive analysis. To reveal detailed information on algorithmic discrimination, DiscriLens identifies a collection of potentially discriminatory itemsets based on causal modeling and classification rules mining. By combining an extended Euler diagram with a matrix-based visualization, we develop a novel set visualization to facilitate the exploration and interpretation of discriminatory itemsets. A user study shows that users can interpret the visually encoded information in DiscriLens quickly and accurately. Use cases demonstrate that DiscriLens provides informative guidance in understanding and reducing algorithmic discrimination.
HypoML: Visual Analysis for Hypothesis-based Evaluation of Machine Learning Models
Feb 12, 2020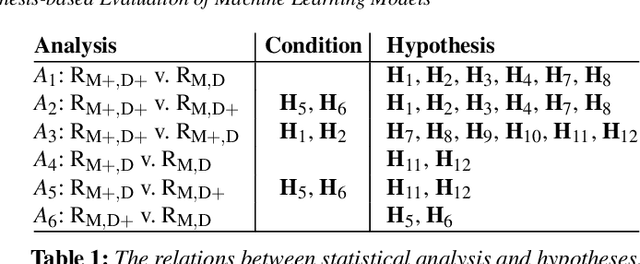


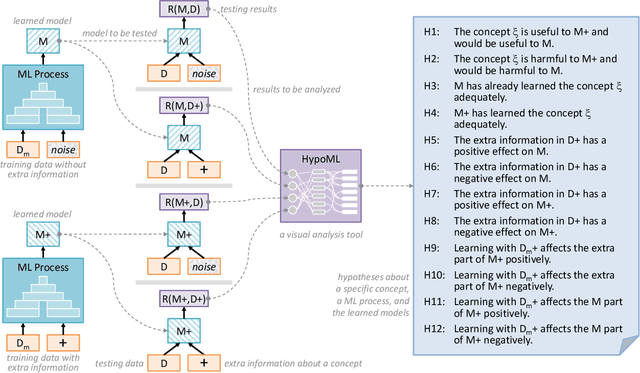
Abstract:In this paper, we present a visual analytics tool for enabling hypothesis-based evaluation of machine learning (ML) models. We describe a novel ML-testing framework that combines the traditional statistical hypothesis testing (commonly used in empirical research) with logical reasoning about the conclusions of multiple hypotheses. The framework defines a controlled configuration for testing a number of hypotheses as to whether and how some extra information about a "concept" or "feature" may benefit or hinder a ML model. Because reasoning multiple hypotheses is not always straightforward, we provide HypoML as a visual analysis tool, with which, the multi-thread testing data is transformed to a visual representation for rapid observation of the conclusions and the logical flow between the testing data and hypotheses.We have applied HypoML to a number of hypothesized concepts, demonstrating the intuitive and explainable nature of the visual analysis.
DeepDrawing: A Deep Learning Approach to Graph Drawing
Jul 27, 2019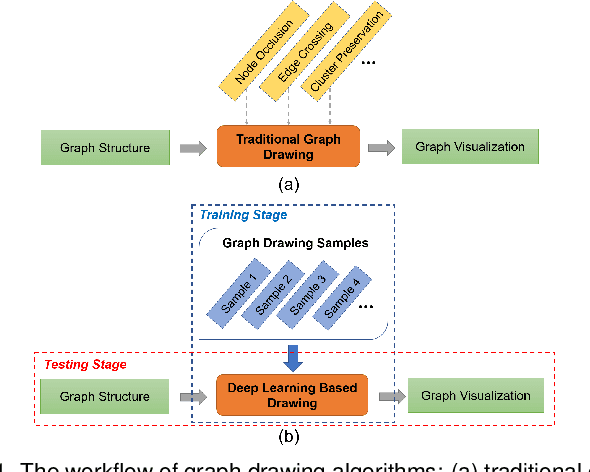

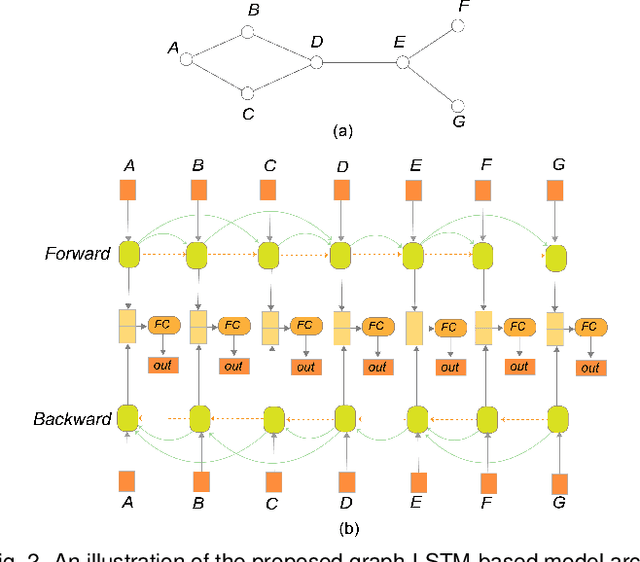

Abstract:Node-link diagrams are widely used to facilitate network explorations. However, when using a graph drawing technique to visualize networks, users often need to tune different algorithm-specific parameters iteratively by comparing the corresponding drawing results in order to achieve a desired visual effect. This trial and error process is often tedious and time-consuming, especially for non-expert users. Inspired by the powerful data modelling and prediction capabilities of deep learning techniques, we explore the possibility of applying deep learning techniques to graph drawing. Specifically, we propose using a graph-LSTM-based approach to directly map network structures to graph drawings. Given a set of layout examples as the training dataset, we train the proposed graph-LSTM-based model to capture their layout characteristics. Then, the trained model is used to generate graph drawings in a similar style for new networks. We evaluated the proposed approach on two special types of layouts (i.e., grid layouts and star layouts) and two general types of layouts (i.e., ForceAtlas2 and PivotMDS) in both qualitative and quantitative ways. The results provide support for the effectiveness of our approach. We also conducted a time cost assessment on the drawings of small graphs with 20 to 50 nodes. We further report the lessons we learned and discuss the limitations and future work.
ATMSeer: Increasing Transparency and Controllability in Automated Machine Learning
Feb 13, 2019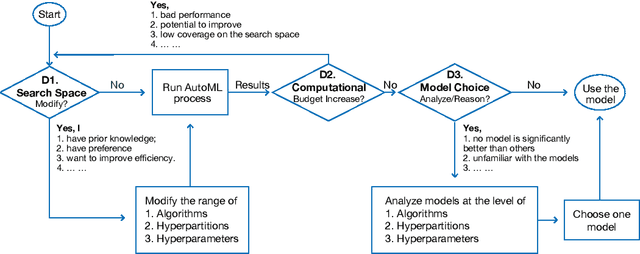
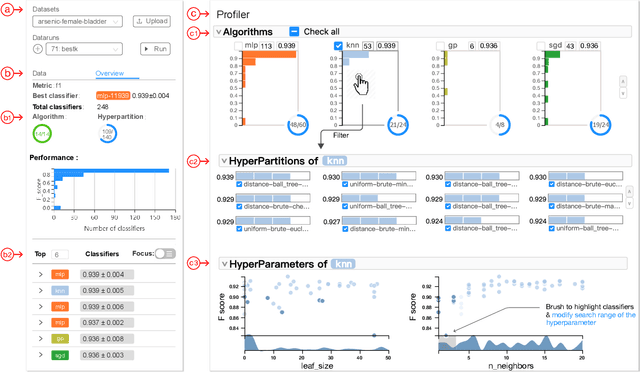
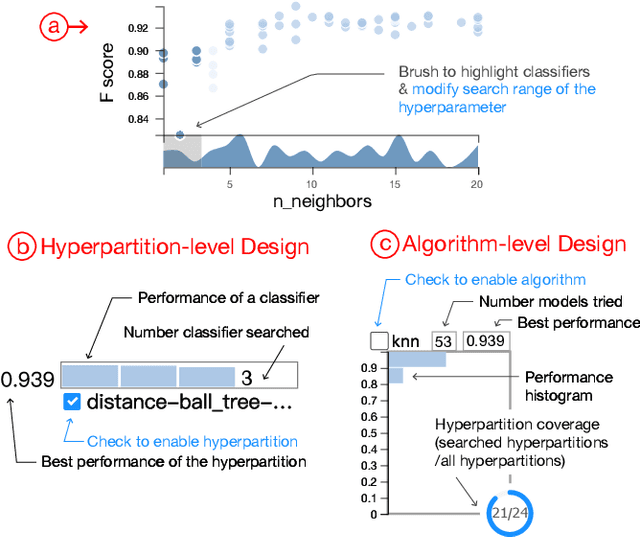
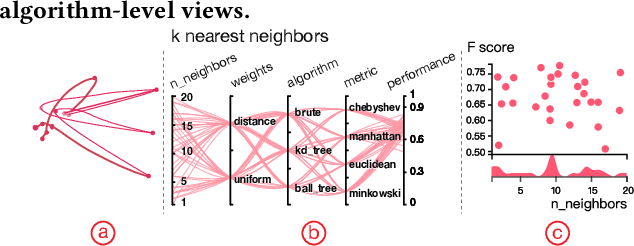
Abstract:To relieve the pain of manually selecting machine learning algorithms and tuning hyperparameters, automated machine learning (AutoML) methods have been developed to automatically search for good models. Due to the huge model search space, it is impossible to try all models. Users tend to distrust automatic results and increase the search budget as much as they can, thereby undermining the efficiency of AutoML. To address these issues, we design and implement ATMSeer, an interactive visualization tool that supports users in refining the search space of AutoML and analyzing the results. To guide the design of ATMSeer, we derive a workflow of using AutoML based on interviews with machine learning experts. A multi-granularity visualization is proposed to enable users to monitor the AutoML process, analyze the searched models, and refine the search space in real time. We demonstrate the utility and usability of ATMSeer through two case studies, expert interviews, and a user study with 13 end users.
 Add to Chrome
 Add to Firefox
 Add to Edge