Qiaomu Shen
CapeNext: Rethinking and refining dynamic support information for category-agnostic pose estimation
Nov 17, 2025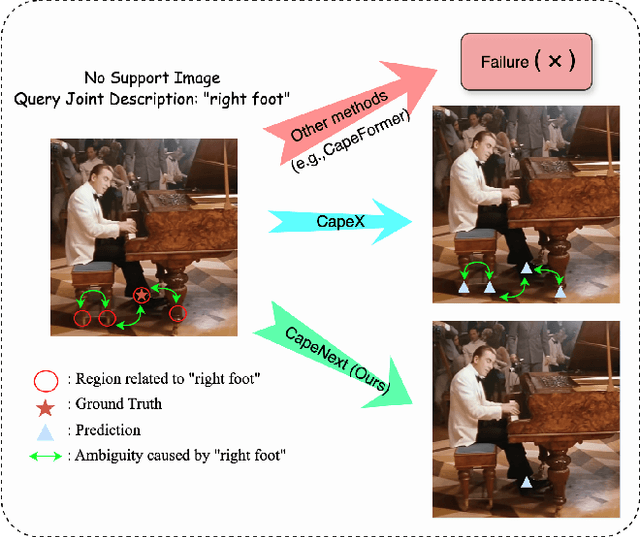
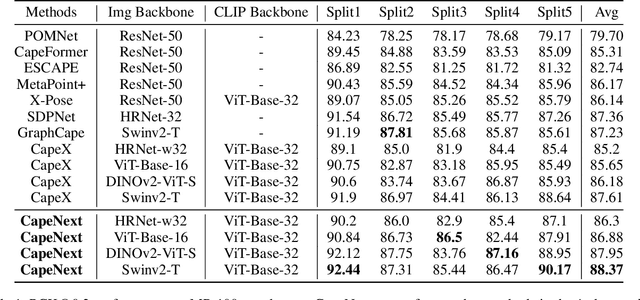
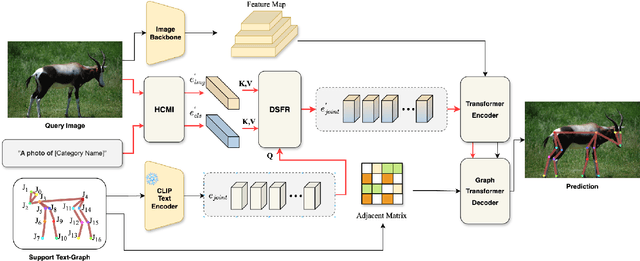
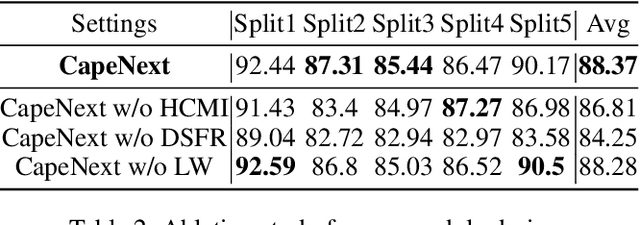
Abstract:Recent research in Category-Agnostic Pose Estimation (CAPE) has adopted fixed textual keypoint description as semantic prior for two-stage pose matching frameworks. While this paradigm enhances robustness and flexibility by disentangling the dependency of support images, our critical analysis reveals two inherent limitations of static joint embedding: (1) polysemy-induced cross-category ambiguity during the matching process(e.g., the concept "leg" exhibiting divergent visual manifestations across humans and furniture), and (2) insufficient discriminability for fine-grained intra-category variations (e.g., posture and fur discrepancies between a sleeping white cat and a standing black cat). To overcome these challenges, we propose a new framework that innovatively integrates hierarchical cross-modal interaction with dual-stream feature refinement, enhancing the joint embedding with both class-level and instance-specific cues from textual description and specific images. Experiments on the MP-100 dataset demonstrate that, regardless of the network backbone, CapeNext consistently outperforms state-of-the-art CAPE methods by a large margin.
AlayaDB: The Data Foundation for Efficient and Effective Long-context LLM Inference
Apr 14, 2025Abstract:AlayaDB is a cutting-edge vector database system natively architected for efficient and effective long-context inference for Large Language Models (LLMs) at AlayaDB AI. Specifically, it decouples the KV cache and attention computation from the LLM inference systems, and encapsulates them into a novel vector database system. For the Model as a Service providers (MaaS), AlayaDB consumes fewer hardware resources and offers higher generation quality for various workloads with different kinds of Service Level Objectives (SLOs), when comparing with the existing alternative solutions (e.g., KV cache disaggregation, retrieval-based sparse attention). The crux of AlayaDB is that it abstracts the attention computation and cache management for LLM inference into a query processing procedure, and optimizes the performance via a native query optimizer. In this work, we demonstrate the effectiveness of AlayaDB via (i) three use cases from our industry partners, and (ii) extensive experimental results on LLM inference benchmarks.
ChartifyText: Automated Chart Generation from Data-Involved Texts via LLM
Oct 18, 2024


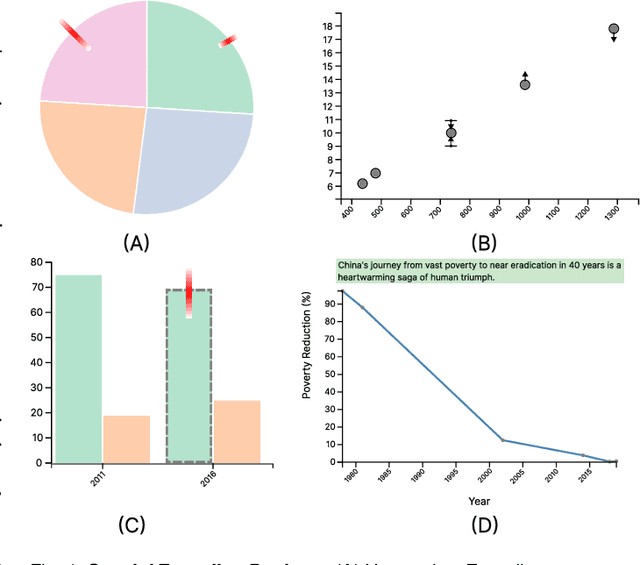
Abstract:Text documents with numerical values involved are widely used in various applications such as scientific research, economy, public health and journalism. However, it is difficult for readers to quickly interpret such data-involved texts and gain deep insights. To fill this research gap, this work aims to automatically generate charts to accurately convey the underlying data and ideas to readers, which is essentially a challenging task. The challenges originate from text ambiguities, intrinsic sparsity and uncertainty of data in text documents, and subjective sentiment differences. Specifically, we propose ChartifyText, a novel fully-automated approach that leverages Large Language Models (LLMs) to convert complex data-involved texts to expressive charts. It consists of two major modules: tabular data inference and expressive chart generation. The tabular data inference module employs systematic prompt engineering to guide the LLM (e.g., GPT-4) to infer table data, where data ranges, uncertainties, missing data values and corresponding subjective sentiments are explicitly considered. The expressive chart generation module augments standard charts with intuitive visual encodings and concise texts to accurately convey the underlying data and insights. We extensively evaluate the effectiveness of ChartifyText on real-world data-involved text documents through case studies, in-depth interviews with three visualization experts, and a carefully-designed user study with 15 participants. The results demonstrate the usefulness and effectiveness of ChartifyText in helping readers efficiently and effectively make sense of data-involved texts.
ATMSeer: Increasing Transparency and Controllability in Automated Machine Learning
Feb 13, 2019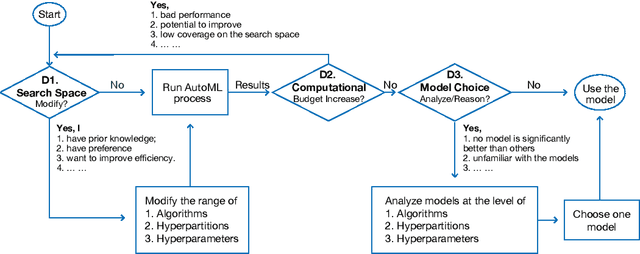
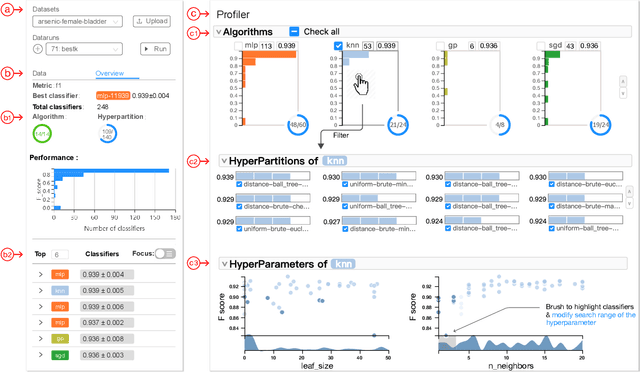
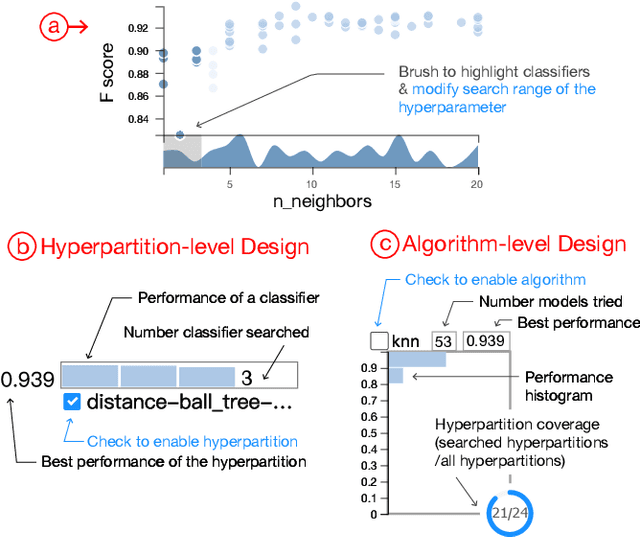
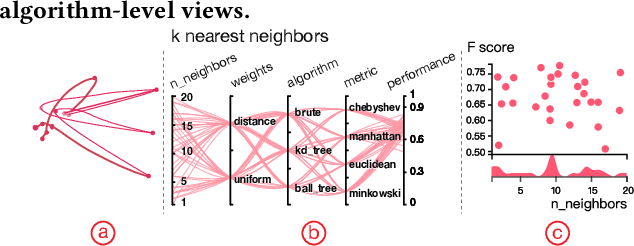
Abstract:To relieve the pain of manually selecting machine learning algorithms and tuning hyperparameters, automated machine learning (AutoML) methods have been developed to automatically search for good models. Due to the huge model search space, it is impossible to try all models. Users tend to distrust automatic results and increase the search budget as much as they can, thereby undermining the efficiency of AutoML. To address these issues, we design and implement ATMSeer, an interactive visualization tool that supports users in refining the search space of AutoML and analyzing the results. To guide the design of ATMSeer, we derive a workflow of using AutoML based on interviews with machine learning experts. A multi-granularity visualization is proposed to enable users to monitor the AutoML process, analyze the searched models, and refine the search space in real time. We demonstrate the utility and usability of ATMSeer through two case studies, expert interviews, and a user study with 13 end users.
 Add to Chrome
 Add to Firefox
 Add to Edge