Songheng Zhang
ChartifyText: Automated Chart Generation from Data-Involved Texts via LLM
Oct 18, 2024


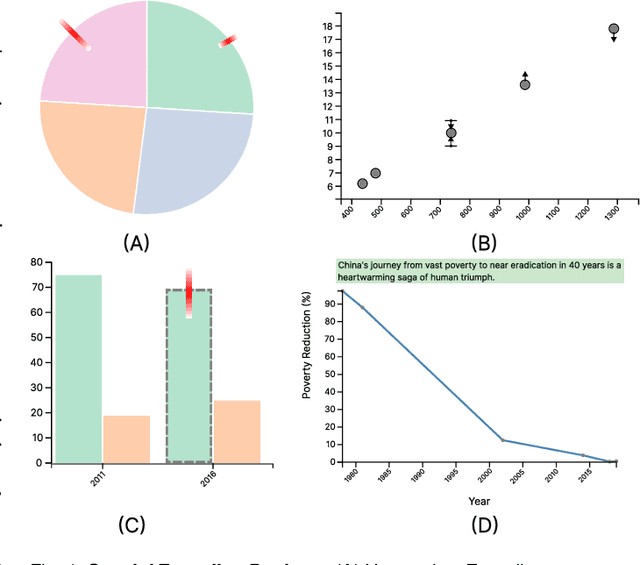
Abstract:Text documents with numerical values involved are widely used in various applications such as scientific research, economy, public health and journalism. However, it is difficult for readers to quickly interpret such data-involved texts and gain deep insights. To fill this research gap, this work aims to automatically generate charts to accurately convey the underlying data and ideas to readers, which is essentially a challenging task. The challenges originate from text ambiguities, intrinsic sparsity and uncertainty of data in text documents, and subjective sentiment differences. Specifically, we propose ChartifyText, a novel fully-automated approach that leverages Large Language Models (LLMs) to convert complex data-involved texts to expressive charts. It consists of two major modules: tabular data inference and expressive chart generation. The tabular data inference module employs systematic prompt engineering to guide the LLM (e.g., GPT-4) to infer table data, where data ranges, uncertainties, missing data values and corresponding subjective sentiments are explicitly considered. The expressive chart generation module augments standard charts with intuitive visual encodings and concise texts to accurately convey the underlying data and insights. We extensively evaluate the effectiveness of ChartifyText on real-world data-involved text documents through case studies, in-depth interviews with three visualization experts, and a carefully-designed user study with 15 participants. The results demonstrate the usefulness and effectiveness of ChartifyText in helping readers efficiently and effectively make sense of data-involved texts.
LLM4Vis: Explainable Visualization Recommendation using ChatGPT
Oct 16, 2023Abstract:Data visualization is a powerful tool for exploring and communicating insights in various domains. To automate visualization choice for datasets, a task known as visualization recommendation has been proposed. Various machine-learning-based approaches have been developed for this purpose, but they often require a large corpus of dataset-visualization pairs for training and lack natural explanations for their results. To address this research gap, we propose LLM4Vis, a novel ChatGPT-based prompting approach to perform visualization recommendation and return human-like explanations using very few demonstration examples. Our approach involves feature description, demonstration example selection, explanation generation, demonstration example construction, and inference steps. To obtain demonstration examples with high-quality explanations, we propose a new explanation generation bootstrapping to iteratively refine generated explanations by considering the previous generation and template-based hint. Evaluations on the VizML dataset show that LLM4Vis outperforms or performs similarly to supervised learning models like Random Forest, Decision Tree, and MLP in both few-shot and zero-shot settings. The qualitative evaluation also shows the effectiveness of explanations generated by LLM4Vis. We make our code publicly available at \href{https://github.com/demoleiwang/LLM4Vis}{https://github.com/demoleiwang/LLM4Vis}.
 Add to Chrome
 Add to Firefox
 Add to Edge