Haipeng Zeng
GestureLens: Visual Analysis of Gestures in Presentation Videos
Apr 23, 2022
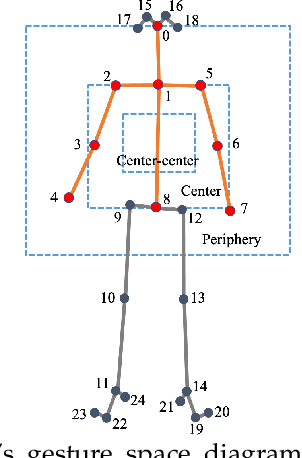
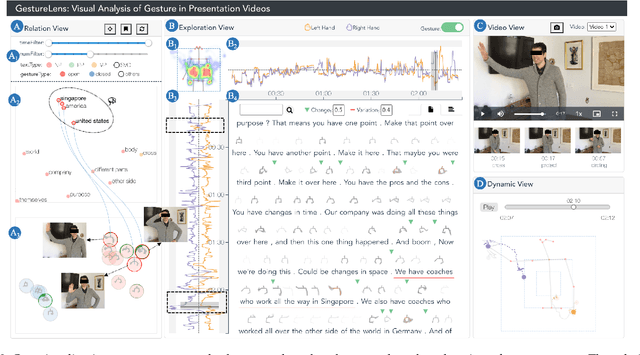
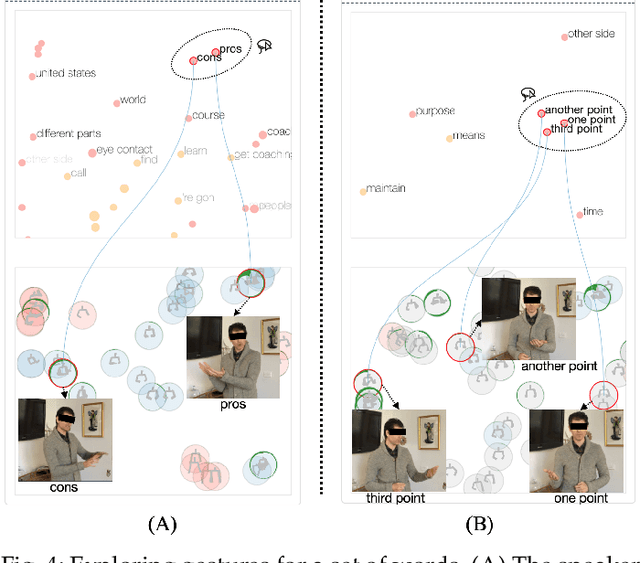
Abstract:Appropriate gestures can enhance message delivery and audience engagement in both daily communication and public presentations. In this paper, we contribute a visual analytic approach that assists professional public speaking coaches in improving their practice of gesture training through analyzing presentation videos. Manually checking and exploring gesture usage in the presentation videos is often tedious and time-consuming. There lacks an efficient method to help users conduct gesture exploration, which is challenging due to the intrinsically temporal evolution of gestures and their complex correlation to speech content. In this paper, we propose GestureLens, a visual analytics system to facilitate gesture-based and content-based exploration of gesture usage in presentation videos. Specifically, the exploration view enables users to obtain a quick overview of the spatial and temporal distributions of gestures. The dynamic hand movements are firstly aggregated through a heatmap in the gesture space for uncovering spatial patterns, and then decomposed into two mutually perpendicular timelines for revealing temporal patterns. The relation view allows users to explicitly explore the correlation between speech content and gestures by enabling linked analysis and intuitive glyph designs. The video view and dynamic view show the context and overall dynamic movement of the selected gestures, respectively. Two usage scenarios and expert interviews with professional presentation coaches demonstrate the effectiveness and usefulness of GestureLens in facilitating gesture exploration and analysis of presentation videos.
DeHumor: Visual Analytics for Decomposing Humor
Jul 18, 2021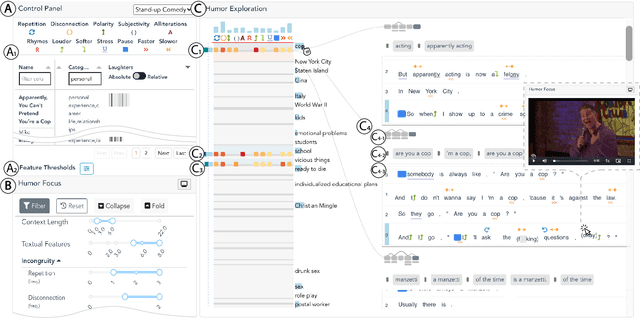
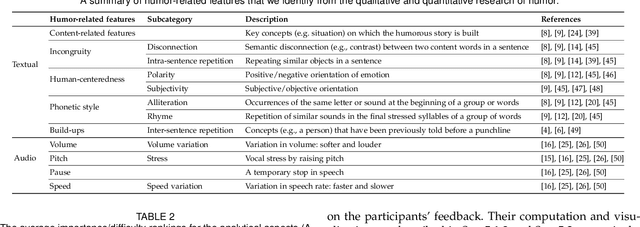


Abstract:Despite being a critical communication skill, grasping humor is challenging -- a successful use of humor requires a mixture of both engaging content build-up and an appropriate vocal delivery (e.g., pause). Prior studies on computational humor emphasize the textual and audio features immediately next to the punchline, yet overlooking longer-term context setup. Moreover, the theories are usually too abstract for understanding each concrete humor snippet. To fill in the gap, we develop DeHumor, a visual analytical system for analyzing humorous behaviors in public speaking. To intuitively reveal the building blocks of each concrete example, DeHumor decomposes each humorous video into multimodal features and provides inline annotations of them on the video script. In particular, to better capture the build-ups, we introduce content repetition as a complement to features introduced in theories of computational humor and visualize them in a context linking graph. To help users locate the punchlines that have the desired features to learn, we summarize the content (with keywords) and humor feature statistics on an augmented time matrix. With case studies on stand-up comedy shows and TED talks, we show that DeHumor is able to highlight various building blocks of humor examples. In addition, expert interviews with communication coaches and humor researchers demonstrate the effectiveness of DeHumor for multimodal humor analysis of speech content and vocal delivery.
VoiceCoach: Interactive Evidence-based Training for Voice Modulation Skills in Public Speaking
Jan 22, 2020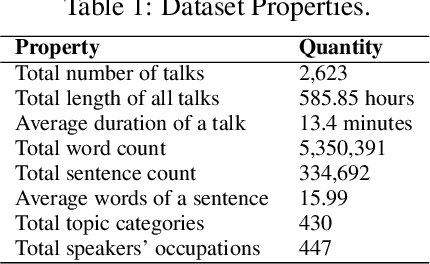
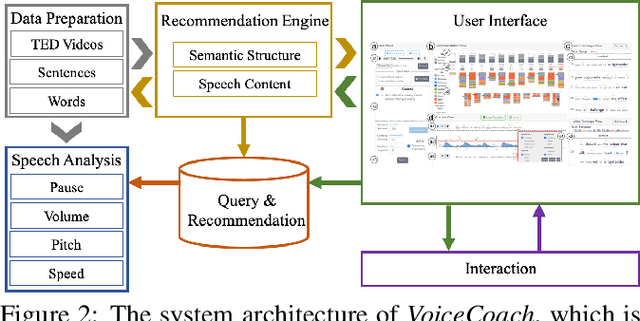
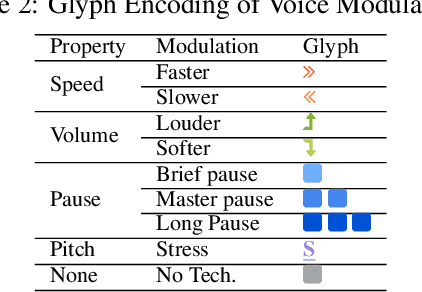
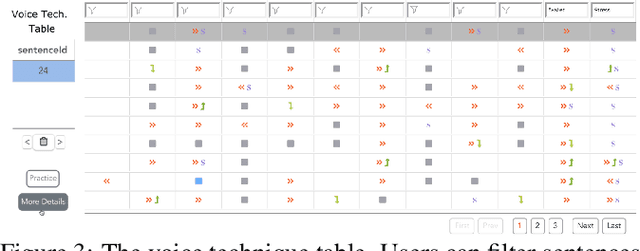
Abstract:The modulation of voice properties, such as pitch, volume, and speed, is crucial for delivering a successful public speech. However, it is challenging to master different voice modulation skills. Though many guidelines are available, they are often not practical enough to be applied in different public speaking situations, especially for novice speakers. We present VoiceCoach, an interactive evidence-based approach to facilitate the effective training of voice modulation skills. Specifically, we have analyzed the voice modulation skills from 2623 high-quality speeches (i.e., TED Talks) and use them as the benchmark dataset. Given a voice input, VoiceCoach automatically recommends good voice modulation examples from the dataset based on the similarity of both sentence structures and voice modulation skills. Immediate and quantitative visual feedback is provided to guide further improvement. The expert interviews and the user study provide support for the effectiveness and usability of VoiceCoach.
EmoCo: Visual Analysis of Emotion Coherence in Presentation Videos
Jul 29, 2019
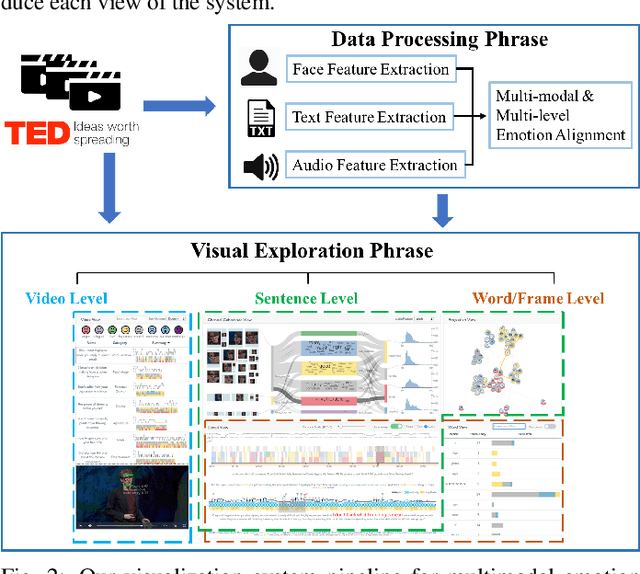


Abstract:Emotions play a key role in human communication and public presentations. Human emotions are usually expressed through multiple modalities. Therefore, exploring multimodal emotions and their coherence is of great value for understanding emotional expressions in presentations and improving presentation skills. However, manually watching and studying presentation videos is often tedious and time-consuming. There is a lack of tool support to help conduct an efficient and in-depth multi-level analysis. Thus, in this paper, we introduce EmoCo, an interactive visual analytics system to facilitate efficient analysis of emotion coherence across facial, text, and audio modalities in presentation videos. Our visualization system features a channel coherence view and a sentence clustering view that together enable users to obtain a quick overview of emotion coherence and its temporal evolution. In addition, a detail view and word view enable detailed exploration and comparison from the sentence level and word level, respectively. We thoroughly evaluate the proposed system and visualization techniques through two usage scenarios based on TED Talk videos and interviews with two domain experts. The results demonstrate the effectiveness of our system in gaining insights into emotion coherence in presentations.
CNNComparator: Comparative Analytics of Convolutional Neural Networks
Oct 15, 2017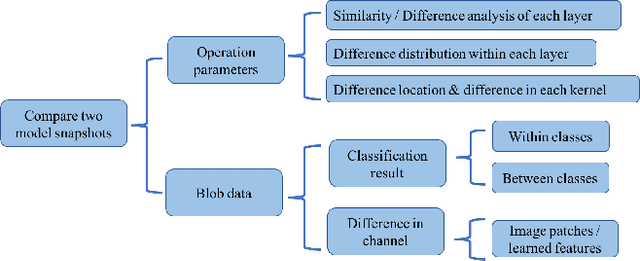


Abstract:Convolutional neural networks (CNNs) are widely used in many image recognition tasks due to their extraordinary performance. However, training a good CNN model can still be a challenging task. In a training process, a CNN model typically learns a large number of parameters over time, which usually results in different performance. Often, it is difficult to explore the relationships between the learned parameters and the model performance due to a large number of parameters and different random initializations. In this paper, we present a visual analytics approach to compare two different snapshots of a trained CNN model taken after different numbers of epochs, so as to provide some insight into the design or the training of a better CNN model. Our system compares snapshots by exploring the differences in operation parameters and the corresponding blob data at different levels. A case study has been conducted to demonstrate the effectiveness of our system.
 Add to Chrome
 Add to Firefox
 Add to Edge