Hammad Haleem
Evaluating the Readability of Force Directed Graph Layouts: A Deep Learning Approach
Aug 02, 2018


Abstract:Existing graph layout algorithms are usually not able to optimize all the aesthetic properties desired in a graph layout. To evaluate how well the desired visual features are reflected in a graph layout, many readability metrics have been proposed in the past decades. However, the calculation of these readability metrics often requires access to the node and edge coordinates and is usually computationally inefficient, especially for dense graphs. Importantly, when the node and edge coordinates are not accessible, it becomes impossible to evaluate the graph layouts quantitatively. In this paper, we present a novel deep learning-based approach to evaluate the readability of graph layouts by directly using graph images. A convolutional neural network architecture is proposed and trained on a benchmark dataset of graph images, which is composed of synthetically-generated graphs and graphs created by sampling from real large networks. Multiple representative readability metrics (including edge crossing, node spread, and group overlap) are considered in the proposed approach. We quantitatively compare our approach to traditional methods and qualitatively evaluate our approach using a case study and visualizing convolutional layers. This work is a first step towards using deep learning based methods to evaluate images from the visualization field quantitatively.
CNNComparator: Comparative Analytics of Convolutional Neural Networks
Oct 15, 2017


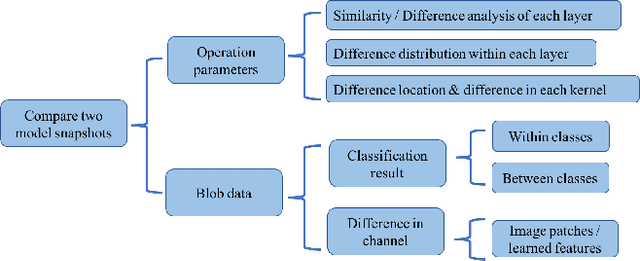
Abstract:Convolutional neural networks (CNNs) are widely used in many image recognition tasks due to their extraordinary performance. However, training a good CNN model can still be a challenging task. In a training process, a CNN model typically learns a large number of parameters over time, which usually results in different performance. Often, it is difficult to explore the relationships between the learned parameters and the model performance due to a large number of parameters and different random initializations. In this paper, we present a visual analytics approach to compare two different snapshots of a trained CNN model taken after different numbers of epochs, so as to provide some insight into the design or the training of a better CNN model. Our system compares snapshots by exploring the differences in operation parameters and the corresponding blob data at different levels. A case study has been conducted to demonstrate the effectiveness of our system.
 Add to Chrome
 Add to Firefox
 Add to Edge