Nan Cao
DensiCrafter: Physically-Constrained Generation and Fabrication of Self-Supporting Hollow Structures
Nov 12, 2025Abstract:The rise of 3D generative models has enabled automatic 3D geometry and texture synthesis from multimodal inputs (e.g., text or images). However, these methods often ignore physical constraints and manufacturability considerations. In this work, we address the challenge of producing 3D designs that are both lightweight and self-supporting. We present DensiCrafter, a framework for generating lightweight, self-supporting 3D hollow structures by optimizing the density field. Starting from coarse voxel grids produced by Trellis, we interpret these as continuous density fields to optimize and introduce three differentiable, physically constrained, and simulation-free loss terms. Additionally, a mass regularization penalizes unnecessary material, while a restricted optimization domain preserves the outer surface. Our method seamlessly integrates with pretrained Trellis-based models (e.g., Trellis, DSO) without any architectural changes. In extensive evaluations, we achieve up to 43% reduction in material mass on the text-to-3D task. Compared to state-of-the-art baselines, our method could improve the stability and maintain high geometric fidelity. Real-world 3D-printing experiments confirm that our hollow designs can be reliably fabricated and could be self-supporting.
DataScout: Automatic Data Fact Retrieval for Statement Augmentation with an LLM-Based Agent
Apr 24, 2025
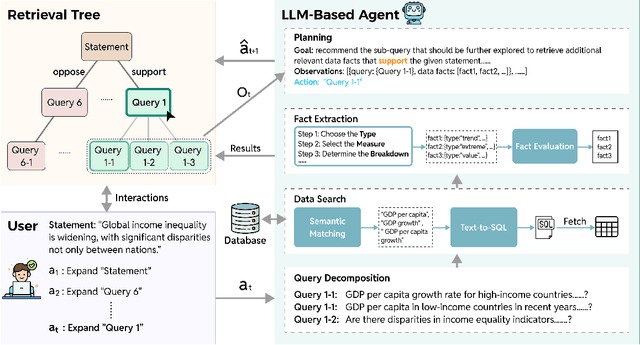
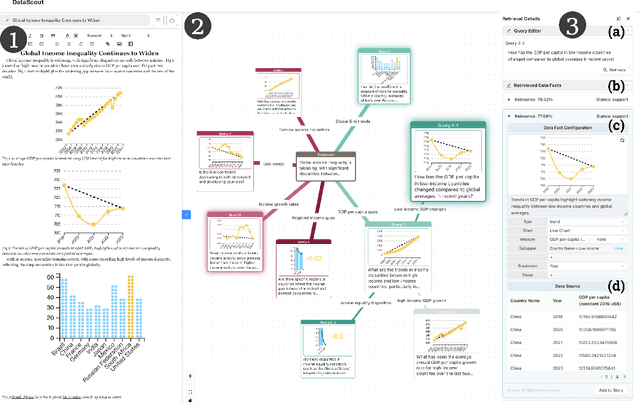
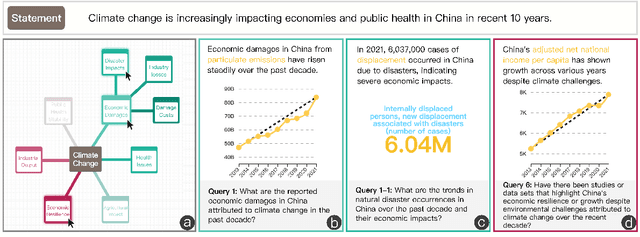
Abstract:A data story typically integrates data facts from multiple perspectives and stances to construct a comprehensive and objective narrative. However, retrieving these facts demands time for data search and challenges the creator's analytical skills. In this work, we introduce DataScout, an interactive system that automatically performs reasoning and stance-based data facts retrieval to augment the user's statement. Particularly, DataScout leverages an LLM-based agent to construct a retrieval tree, enabling collaborative control of its expansion between users and the agent. The interface visualizes the retrieval tree as a mind map that eases users to intuitively steer the retrieval direction and effectively engage in reasoning and analysis. We evaluate the proposed system through case studies and in-depth expert interviews. Our evaluation demonstrates that DataScout can effectively retrieve multifaceted data facts from different stances, helping users verify their statements and enhance the credibility of their stories.
EmotiCrafter: Text-to-Emotional-Image Generation based on Valence-Arousal Model
Jan 10, 2025Abstract:Recent research shows that emotions can enhance users' cognition and influence information communication. While research on visual emotion analysis is extensive, limited work has been done on helping users generate emotionally rich image content. Existing work on emotional image generation relies on discrete emotion categories, making it challenging to capture complex and subtle emotional nuances accurately. Additionally, these methods struggle to control the specific content of generated images based on text prompts. In this work, we introduce the new task of continuous emotional image content generation (C-EICG) and present EmotiCrafter, an emotional image generation model that generates images based on text prompts and Valence-Arousal values. Specifically, we propose a novel emotion-embedding mapping network that embeds Valence-Arousal values into textual features, enabling the capture of specific emotions in alignment with intended input prompts. Additionally, we introduce a loss function to enhance emotion expression. The experimental results show that our method effectively generates images representing specific emotions with the desired content and outperforms existing techniques.
Way to Specialist: Closing Loop Between Specialized LLM and Evolving Domain Knowledge Graph
Nov 28, 2024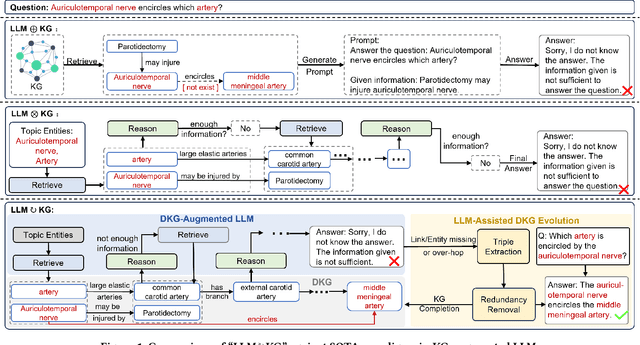
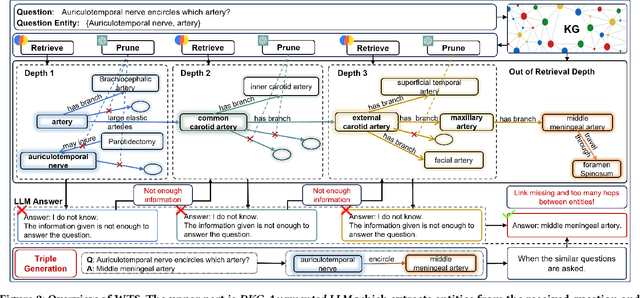
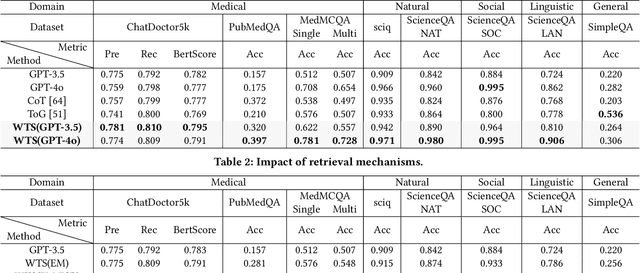
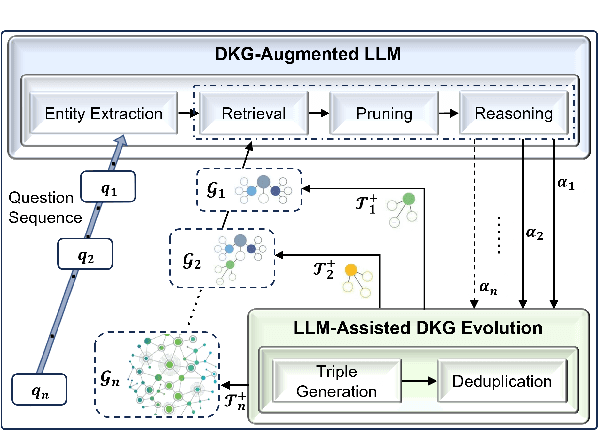
Abstract:Large language models (LLMs) have demonstrated exceptional performance across a wide variety of domains. Nonetheless, generalist LLMs continue to fall short in reasoning tasks necessitating specialized knowledge. Prior investigations into specialized LLMs focused on domain-specific training, which entails substantial efforts in domain data acquisition and model parameter fine-tuning. To address these challenges, this paper proposes the Way-to-Specialist (WTS) framework, which synergizes retrieval-augmented generation with knowledge graphs (KGs) to enhance the specialized capability of LLMs in the absence of specialized training. In distinction to existing paradigms that merely utilize external knowledge from general KGs or static domain KGs to prompt LLM for enhanced domain-specific reasoning, WTS proposes an innovative "LLM$\circlearrowright$KG" paradigm, which achieves bidirectional enhancement between specialized LLM and domain knowledge graph (DKG). The proposed paradigm encompasses two closely coupled components: the DKG-Augmented LLM and the LLM-Assisted DKG Evolution. The former retrieves question-relevant domain knowledge from DKG and uses it to prompt LLM to enhance the reasoning capability for domain-specific tasks; the latter leverages LLM to generate new domain knowledge from processed tasks and use it to evolve DKG. WTS closes the loop between DKG-Augmented LLM and LLM-Assisted DKG Evolution, enabling continuous improvement in the domain specialization as it progressively answers and learns from domain-specific questions. We validate the performance of WTS on 6 datasets spanning 5 domains. The experimental results show that WTS surpasses the previous SOTA in 4 specialized domains and achieves a maximum performance improvement of 11.3%.
Visual Analysis of Multi-outcome Causal Graphs
Jul 31, 2024Abstract:We introduce a visual analysis method for multiple causal graphs with different outcome variables, namely, multi-outcome causal graphs. Multi-outcome causal graphs are important in healthcare for understanding multimorbidity and comorbidity. To support the visual analysis, we collaborated with medical experts to devise two comparative visualization techniques at different stages of the analysis process. First, a progressive visualization method is proposed for comparing multiple state-of-the-art causal discovery algorithms. The method can handle mixed-type datasets comprising both continuous and categorical variables and assist in the creation of a fine-tuned causal graph of a single outcome. Second, a comparative graph layout technique and specialized visual encodings are devised for the quick comparison of multiple causal graphs. In our visual analysis approach, analysts start by building individual causal graphs for each outcome variable, and then, multi-outcome causal graphs are generated and visualized with our comparative technique for analyzing differences and commonalities of these causal graphs. Evaluation includes quantitative measurements on benchmark datasets, a case study with a medical expert, and expert user studies with real-world health research data.
Scalable Optimal Margin Distribution Machine
May 08, 2023Abstract:Optimal margin Distribution Machine (ODM) is a newly proposed statistical learning framework rooting in the novel margin theory, which demonstrates better generalization performance than the traditional large margin based counterparts. Nonetheless, it suffers from the ubiquitous scalability problem regarding both computation time and memory as other kernel methods. This paper proposes a scalable ODM, which can achieve nearly ten times speedup compared to the original ODM training method. For nonlinear kernels, we propose a novel distribution-aware partition method to make the local ODM trained on each partition be close and converge fast to the global one. When linear kernel is applied, we extend a communication efficient SVRG method to accelerate the training further. Extensive empirical studies validate that our proposed method is highly computational efficient and almost never worsen the generalization.
Deep Co-Attention Network for Multi-View Subspace Learning
Feb 15, 2021


Abstract:Many real-world applications involve data from multiple modalities and thus exhibit the view heterogeneity. For example, user modeling on social media might leverage both the topology of the underlying social network and the content of the users' posts; in the medical domain, multiple views could be X-ray images taken at different poses. To date, various techniques have been proposed to achieve promising results, such as canonical correlation analysis based methods, etc. In the meanwhile, it is critical for decision-makers to be able to understand the prediction results from these methods. For example, given the diagnostic result that a model provided based on the X-ray images of a patient at different poses, the doctor needs to know why the model made such a prediction. However, state-of-the-art techniques usually suffer from the inability to utilize the complementary information of each view and to explain the predictions in an interpretable manner. To address these issues, in this paper, we propose a deep co-attention network for multi-view subspace learning, which aims to extract both the common information and the complementary information in an adversarial setting and provide robust interpretations behind the prediction to the end-users via the co-attention mechanism. In particular, it uses a novel cross reconstruction loss and leverages the label information to guide the construction of the latent representation by incorporating the classifier into our model. This improves the quality of latent representation and accelerates the convergence speed. Finally, we develop an efficient iterative algorithm to find the optimal encoders and discriminator, which are evaluated extensively on synthetic and real-world data sets. We also conduct a case study to demonstrate how the proposed method robustly interprets the predictions on an image data set.
Visual Causality Analysis of Event Sequence Data
Sep 01, 2020
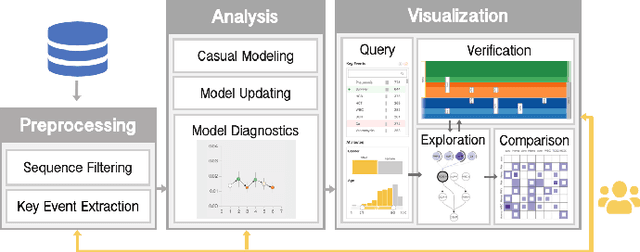

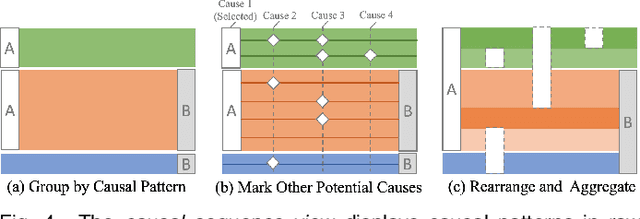
Abstract:Causality is crucial to understanding the mechanisms behind complex systems and making decisions that lead to intended outcomes. Event sequence data is widely collected from many real-world processes, such as electronic health records, web clickstreams, and financial transactions, which transmit a great deal of information reflecting the causal relations among event types. Unfortunately, recovering causalities from observational event sequences is challenging, as the heterogeneous and high-dimensional event variables are often connected to rather complex underlying event excitation mechanisms that are hard to infer from limited observations. Many existing automated causal analysis techniques suffer from poor explainability and fail to include an adequate amount of human knowledge. In this paper, we introduce a visual analytics method for recovering causalities in event sequence data. We extend the Granger causality analysis algorithm on Hawkes processes to incorporate user feedback into causal model refinement. The visualization system includes an interactive causal analysis framework that supports bottom-up causal exploration, iterative causal verification and refinement, and causal comparison through a set of novel visualizations and interactions. We report two forms of evaluation: a quantitative evaluation of the model improvements resulting from the user-feedback mechanism, and a qualitative evaluation through case studies in different application domains to demonstrate the usefulness of the system.
Task-Oriented Optimal Sequencing of Visualization Charts
Aug 07, 2019
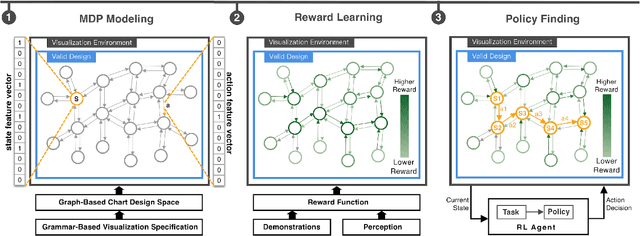
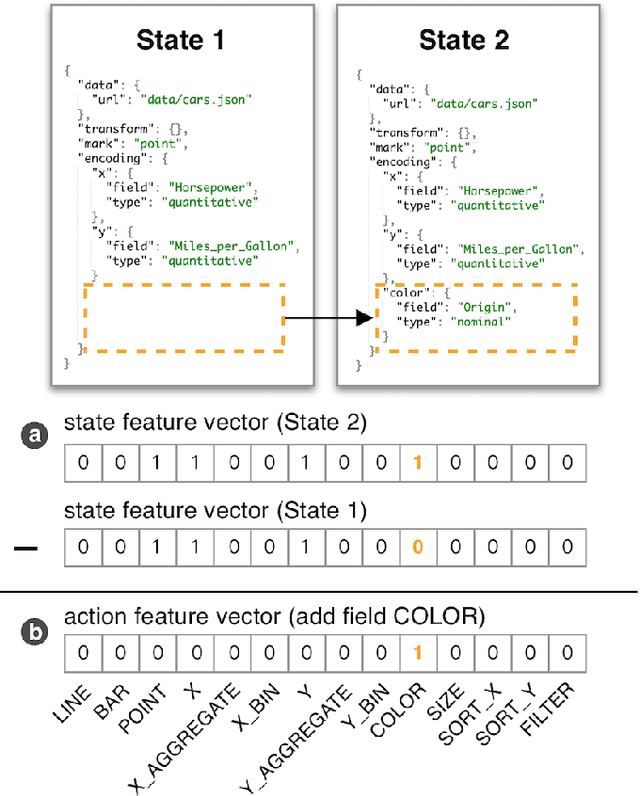
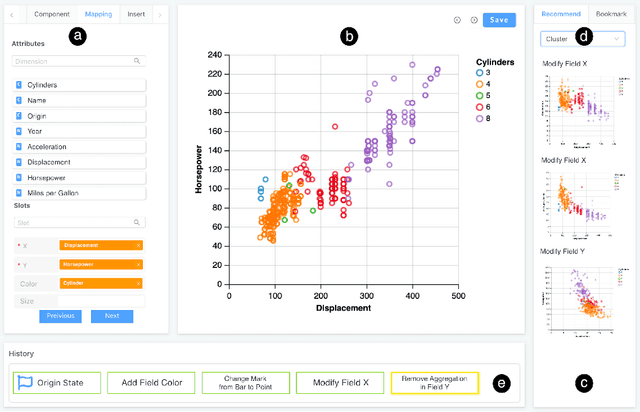
Abstract:A chart sequence is used to describe a series of visualization charts generated in the exploratory analysis by data analysts. It provides information details in each chart as well as a logical relationship among charts. While existing research targets on generating chart sequences that match human's perceptions, little attention has been paid to formulate task-oriented connections between charts in a chart design space. We present a novel chart sequencing method based on reinforcement learning to capture the connections between charts in the context of three major analysis tasks, including correlation analysis, anomaly detection, and cluster analysis. The proposed method formulates a chart sequencing procedure as an optimization problem, which seeks an optimal policy to sequencing charts for the specific analysis task. In our method, a novel reward function is introduced, which takes both the analysis task and the factor of human cognition into consideration. We conducted one case study and two user studies to evaluate the effectiveness of our method under the application scenarios of visualization demonstration, sequencing charts for reasoning analysis results, and making a chart design choice. The study results showed the power of our method.
EcoLens: Visual Analysis of Urban Region Dynamics Using Traffic Data
Jul 29, 2019


Abstract:The rapid development of urbanization during the past decades has significantly improved people's lives but also introduced new challenges on effective functional urban planning and transportation management. The functional regions defined based on a static boundary rarely reflect an individual's daily experience of the space in which they live and visit for a variety of purposes. Fortunately, the increasing availability of spatiotemporal data provides unprecedented opportunities for understanding the structure of an urban area in terms of people's activity pattern and how they form the latent regions over time. These ecological regions, where people temporarily share a similar moving behavior during a short period of time, could provide insights into urban planning and smart-city services. However, existing solutions are limited in their capacity of capturing the evolutionary patterns of dynamic latent regions within urban context. In this work, we introduce an interactive visual analysis approach, EcoLens, that allows analysts to progressively explore and analyze the complex dynamic segmentation patterns of a city using traffic data. We propose an extended non-negative Matrix Factorization based algorithm smoothed over both spatial and temporal dimensions to capture the spatiotemporal dynamics of the city. The algorithm also ensures the orthogonality of its result to facilitate the interpretation of different patterns. A suite of visualizations is designed to illustrate the dynamics of city segmentation and the corresponding interactions are added to support the exploration of the segmentation patterns over time. We evaluate the effectiveness of our system via case studies using a real-world dataset and a qualitative interview with the domain expert.
 Add to Chrome
 Add to Firefox
 Add to Edge