Zhuochen Jin
Visual Causality Analysis of Event Sequence Data
Sep 01, 2020


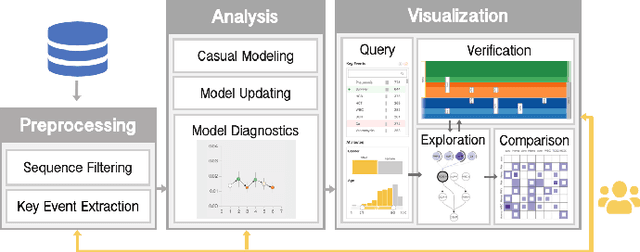
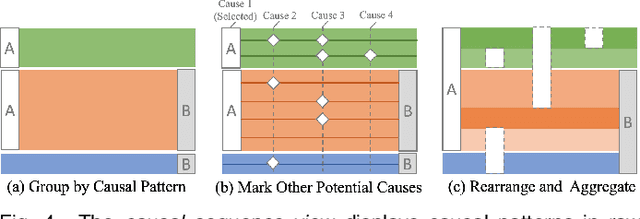
Abstract:Causality is crucial to understanding the mechanisms behind complex systems and making decisions that lead to intended outcomes. Event sequence data is widely collected from many real-world processes, such as electronic health records, web clickstreams, and financial transactions, which transmit a great deal of information reflecting the causal relations among event types. Unfortunately, recovering causalities from observational event sequences is challenging, as the heterogeneous and high-dimensional event variables are often connected to rather complex underlying event excitation mechanisms that are hard to infer from limited observations. Many existing automated causal analysis techniques suffer from poor explainability and fail to include an adequate amount of human knowledge. In this paper, we introduce a visual analytics method for recovering causalities in event sequence data. We extend the Granger causality analysis algorithm on Hawkes processes to incorporate user feedback into causal model refinement. The visualization system includes an interactive causal analysis framework that supports bottom-up causal exploration, iterative causal verification and refinement, and causal comparison through a set of novel visualizations and interactions. We report two forms of evaluation: a quantitative evaluation of the model improvements resulting from the user-feedback mechanism, and a qualitative evaluation through case studies in different application domains to demonstrate the usefulness of the system.
EcoLens: Visual Analysis of Urban Region Dynamics Using Traffic Data
Jul 29, 2019


Abstract:The rapid development of urbanization during the past decades has significantly improved people's lives but also introduced new challenges on effective functional urban planning and transportation management. The functional regions defined based on a static boundary rarely reflect an individual's daily experience of the space in which they live and visit for a variety of purposes. Fortunately, the increasing availability of spatiotemporal data provides unprecedented opportunities for understanding the structure of an urban area in terms of people's activity pattern and how they form the latent regions over time. These ecological regions, where people temporarily share a similar moving behavior during a short period of time, could provide insights into urban planning and smart-city services. However, existing solutions are limited in their capacity of capturing the evolutionary patterns of dynamic latent regions within urban context. In this work, we introduce an interactive visual analysis approach, EcoLens, that allows analysts to progressively explore and analyze the complex dynamic segmentation patterns of a city using traffic data. We propose an extended non-negative Matrix Factorization based algorithm smoothed over both spatial and temporal dimensions to capture the spatiotemporal dynamics of the city. The algorithm also ensures the orthogonality of its result to facilitate the interpretation of different patterns. A suite of visualizations is designed to illustrate the dynamics of city segmentation and the corresponding interactions are added to support the exploration of the segmentation patterns over time. We evaluate the effectiveness of our system via case studies using a real-world dataset and a qualitative interview with the domain expert.
 Add to Chrome
 Add to Firefox
 Add to Edge