Daniel Weiskopf
Maximum entropy and quantized metric models for absolute category ratings
Oct 01, 2024
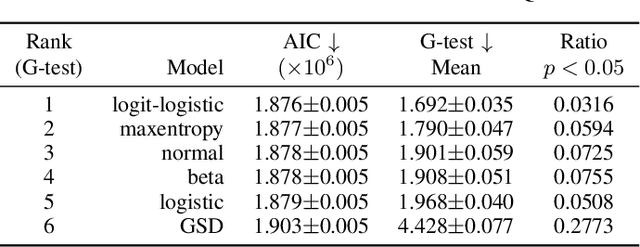
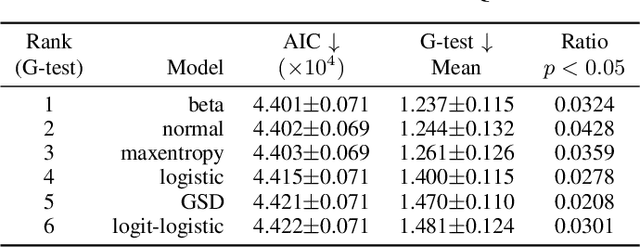
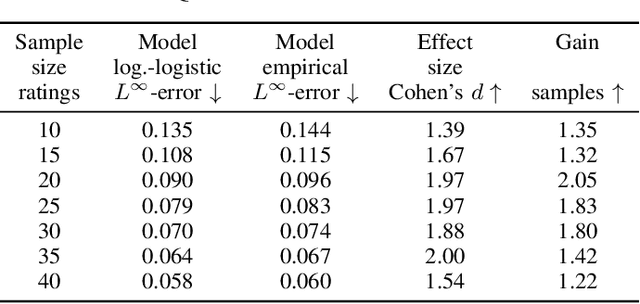
Abstract:The datasets of most image quality assessment studies contain ratings on a categorical scale with five levels, from bad (1) to excellent (5). For each stimulus, the number of ratings from 1 to 5 is summarized and given in the form of the mean opinion score. In this study, we investigate families of multinomial probability distributions parameterized by mean and variance that are used to fit the empirical rating distributions. To this end, we consider quantized metric models based on continuous distributions that model perceived stimulus quality on a latent scale. The probabilities for the rating categories are determined by quantizing the corresponding random variables using threshold values. Furthermore, we introduce a novel discrete maximum entropy distribution for a given mean and variance. We compare the performance of these models and the state of the art given by the generalized score distribution for two large data sets, KonIQ-10k and VQEG HDTV. Given an input distribution of ratings, our fitted two-parameter models predict unseen ratings better than the empirical distribution. In contrast to empirical ACR distributions and their discrete models, our continuous models can provide fine-grained estimates of quantiles of quality of experience that are relevant to service providers to satisfy a target fraction of the user population.
Out-of-Core Dimensionality Reduction for Large Data via Out-of-Sample Extensions
Aug 07, 2024


Abstract:Dimensionality reduction (DR) is a well-established approach for the visualization of high-dimensional data sets. While DR methods are often applied to typical DR benchmark data sets in the literature, they might suffer from high runtime complexity and memory requirements, making them unsuitable for large data visualization especially in environments outside of high-performance computing. To perform DR on large data sets, we propose the use of out-of-sample extensions. Such extensions allow inserting new data into existing projections, which we leverage to iteratively project data into a reference projection that consists only of a small manageable subset. This process makes it possible to perform DR out-of-core on large data, which would otherwise not be possible due to memory and runtime limitations. For metric multidimensional scaling (MDS), we contribute an implementation with out-of-sample projection capability since typical software libraries do not support it. We provide an evaluation of the projection quality of five common DR algorithms (MDS, PCA, t-SNE, UMAP, and autoencoders) using quality metrics from the literature and analyze the trade-off between the size of the reference set and projection quality. The runtime behavior of the algorithms is also quantified with respect to reference set size, out-of-sample batch size, and dimensionality of the data sets. Furthermore, we compare the out-of-sample approach to other recently introduced DR methods, such as PaCMAP and TriMAP, which claim to handle larger data sets than traditional approaches. To showcase the usefulness of DR on this large scale, we contribute a use case where we analyze ensembles of streamlines amounting to one billion projected instances.
Visual Analysis of Multi-outcome Causal Graphs
Jul 31, 2024Abstract:We introduce a visual analysis method for multiple causal graphs with different outcome variables, namely, multi-outcome causal graphs. Multi-outcome causal graphs are important in healthcare for understanding multimorbidity and comorbidity. To support the visual analysis, we collaborated with medical experts to devise two comparative visualization techniques at different stages of the analysis process. First, a progressive visualization method is proposed for comparing multiple state-of-the-art causal discovery algorithms. The method can handle mixed-type datasets comprising both continuous and categorical variables and assist in the creation of a fine-tuned causal graph of a single outcome. Second, a comparative graph layout technique and specialized visual encodings are devised for the quick comparison of multiple causal graphs. In our visual analysis approach, analysts start by building individual causal graphs for each outcome variable, and then, multi-outcome causal graphs are generated and visualized with our comparative technique for analyzing differences and commonalities of these causal graphs. Evaluation includes quantitative measurements on benchmark datasets, a case study with a medical expert, and expert user studies with real-world health research data.
NMF-Based Analysis of Mobile Eye-Tracking Data
Apr 04, 2024


Abstract:The depiction of scanpaths from mobile eye-tracking recordings by thumbnails from the stimulus allows the application of visual computing to detect areas of interest in an unsupervised way. We suggest using nonnegative matrix factorization (NMF) to identify such areas in stimuli. For a user-defined integer k, NMF produces an explainable decomposition into k components, each consisting of a spatial representation associated with a temporal indicator. In the context of multiple eye-tracking recordings, this leads to k spatial representations, where the temporal indicator highlights the appearance within recordings. The choice of k provides an opportunity to control the refinement of the decomposition, i.e., the number of areas to detect. We combine our NMF-based approach with visualization techniques to enable an exploratory analysis of multiple recordings. Finally, we demonstrate the usefulness of our approach with mobile eye-tracking data of an art gallery.
Visualization of Nonlinear Programming for Robot Motion Planning
Jan 28, 2021
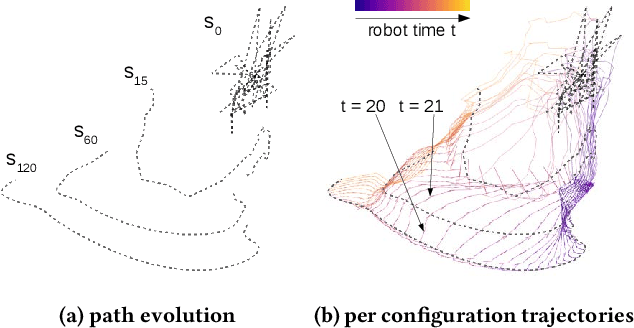
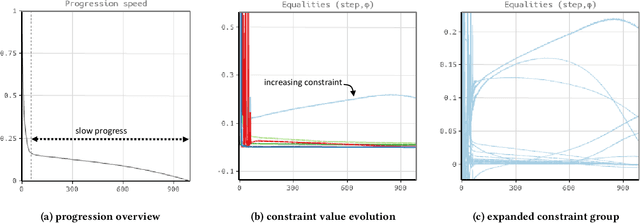
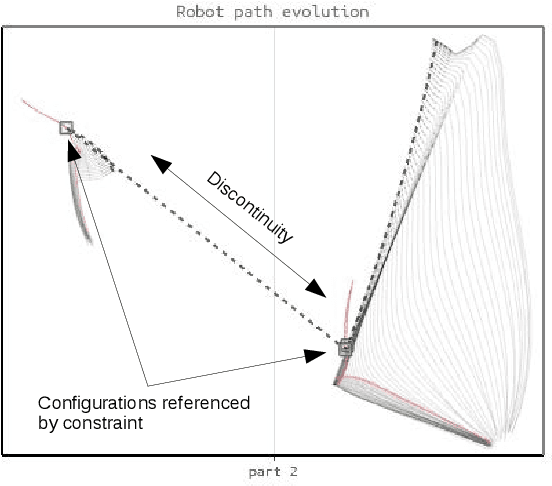
Abstract:Nonlinear programming targets nonlinear optimization with constraints, which is a generic yet complex methodology involving humans for problem modeling and algorithms for problem solving. We address the particularly hard challenge of supporting domain experts in handling, understanding, and trouble-shooting high-dimensional optimization with a large number of constraints. Leveraging visual analytics, users are supported in exploring the computation process of nonlinear constraint optimization. Our system was designed for robot motion planning problems and developed in tight collaboration with domain experts in nonlinear programming and robotics. We report on the experiences from this design study, illustrate the usefulness for relevant example cases, and discuss the extension to visual analytics for nonlinear programming in general.
* 8 pages, 6 figures
Age-Net: An MRI-Based Iterative Framework for Biological Age Estimation
Sep 22, 2020

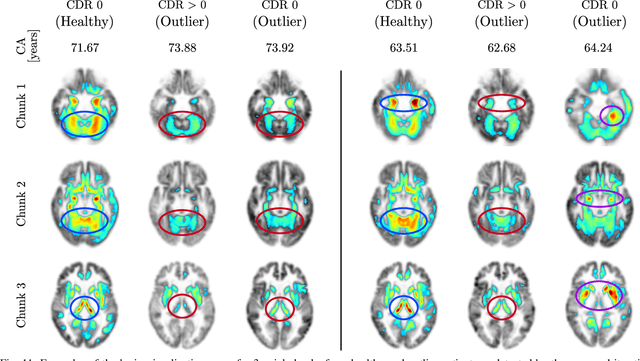
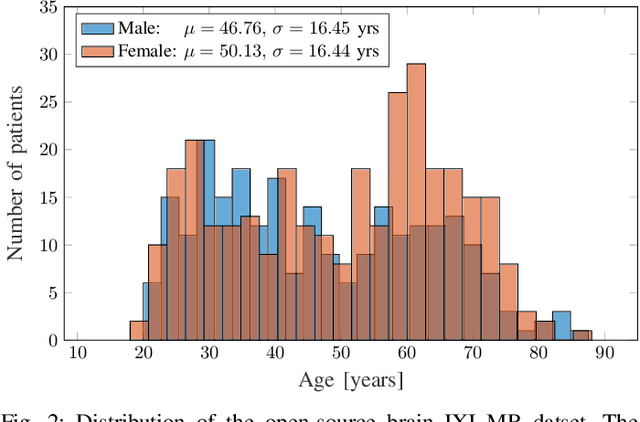
Abstract:The concept of biological age (BA) - although important in clinical practice - is hard to grasp mainly due to lack of a clearly defined reference standard. For specific applications, especially in pediatrics, medical image data are used for BA estimation in a routine clinical context. Beyond this young age group, BA estimation is restricted to whole-body assessment using non-imaging indicators such as blood biomarkers, genetic and cellular data. However, various organ systems may exhibit different aging characteristics due to lifestyle and genetic factors. Thus, a whole-body assessment of the BA does not reflect the deviations of aging behavior between organs. To this end, we propose a new imaging-based framework for organ-specific BA estimation. As a first step, we introduce a chronological age (CA) estimation framework using deep convolutional neural networks (Age-Net). We quantitatively assess the performance of this framework in comparison to existing CA estimation approaches. Furthermore, we expand upon Age-Net with a novel iterative data-cleaning algorithm to segregate atypical-aging patients (BA $\not \approx$ CA) from the given population. In this manner, we hypothesize that the remaining population should approximate the true BA behaviour. For this initial study, we apply the proposed methodology on a brain magnetic resonance image (MRI) dataset containing healthy individuals as well as Alzheimer's patients with different dementia ratings. We demonstrate the correlation between the predicted BAs and the expected cognitive deterioration in Alzheimer's patients. A statistical and visualization-based analysis has provided evidence regarding the potential and current challenges of the proposed methodology.
Implicit Multidimensional Projection of Local Subspaces
Sep 07, 2020


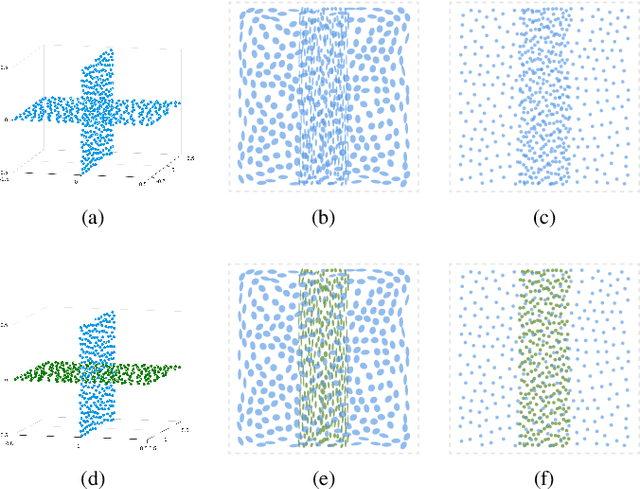
Abstract:We propose a visualization method to understand the effect of multidimensional projection on local subspaces, using implicit function differentiation. Here, we understand the local subspace as the multidimensional local neighborhood of data points. Existing methods focus on the projection of multidimensional data points, and the neighborhood information is ignored. Our method is able to analyze the shape and directional information of the local subspace to gain more insights into the global structure of the data through the perception of local structures. Local subspaces are fitted by multidimensional ellipses that are spanned by basis vectors. An accurate and efficient vector transformation method is proposed based on analytical differentiation of multidimensional projections formulated as implicit functions. The results are visualized as glyphs and analyzed using a full set of specifically-designed interactions supported in our efficient web-based visualization tool. The usefulness of our method is demonstrated using various multi- and high-dimensional benchmark datasets. Our implicit differentiation vector transformation is evaluated through numerical comparisons; the overall method is evaluated through exploration examples and use cases.
Visual Causality Analysis of Event Sequence Data
Sep 01, 2020
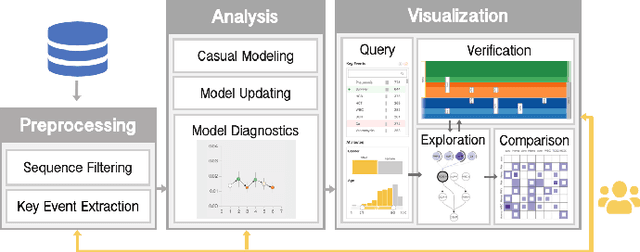

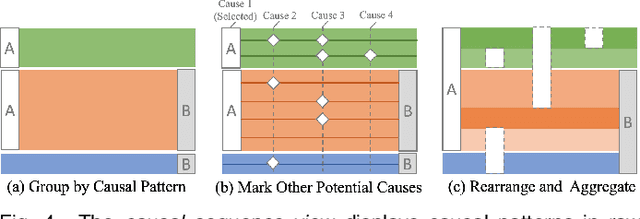
Abstract:Causality is crucial to understanding the mechanisms behind complex systems and making decisions that lead to intended outcomes. Event sequence data is widely collected from many real-world processes, such as electronic health records, web clickstreams, and financial transactions, which transmit a great deal of information reflecting the causal relations among event types. Unfortunately, recovering causalities from observational event sequences is challenging, as the heterogeneous and high-dimensional event variables are often connected to rather complex underlying event excitation mechanisms that are hard to infer from limited observations. Many existing automated causal analysis techniques suffer from poor explainability and fail to include an adequate amount of human knowledge. In this paper, we introduce a visual analytics method for recovering causalities in event sequence data. We extend the Granger causality analysis algorithm on Hawkes processes to incorporate user feedback into causal model refinement. The visualization system includes an interactive causal analysis framework that supports bottom-up causal exploration, iterative causal verification and refinement, and causal comparison through a set of novel visualizations and interactions. We report two forms of evaluation: a quantitative evaluation of the model improvements resulting from the user-feedback mechanism, and a qualitative evaluation through case studies in different application domains to demonstrate the usefulness of the system.
Task Classification Model for Visual Fixation, Exploration, and Search
Jul 29, 2019
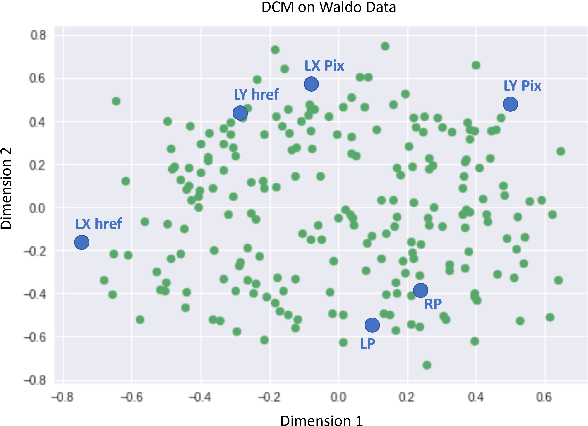
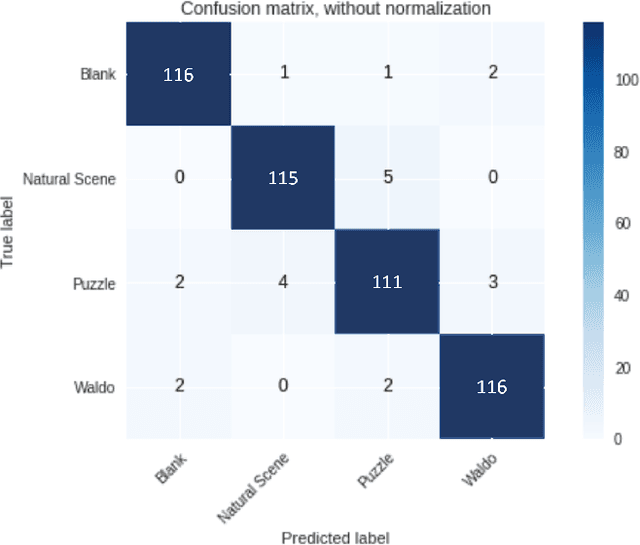
Abstract:Yarbus' claim to decode the observer's task from eye movements has received mixed reactions. In this paper, we have supported the hypothesis that it is possible to decode the task. We conducted an exploratory analysis on the dataset by projecting features and data points into a scatter plot to visualize the nuance properties for each task. Following this analysis, we eliminated highly correlated features before training an SVM and Ada Boosting classifier to predict the tasks from this filtered eye movements data. We achieve an accuracy of 95.4% on this task classification problem and hence, support the hypothesis that task classification is possible from a user's eye movement data.
* 4 pages
Uncertainty-Aware Principal Component Analysis
May 03, 2019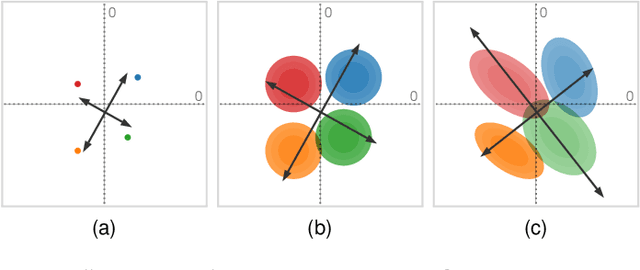
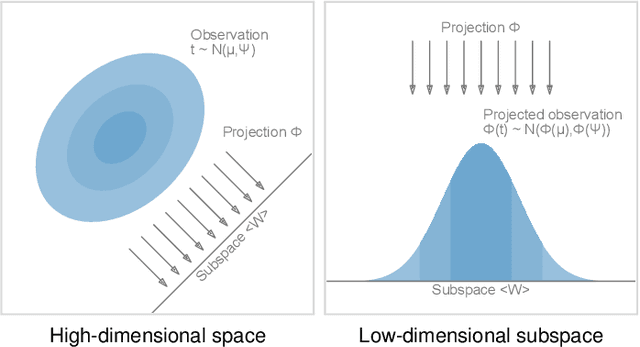
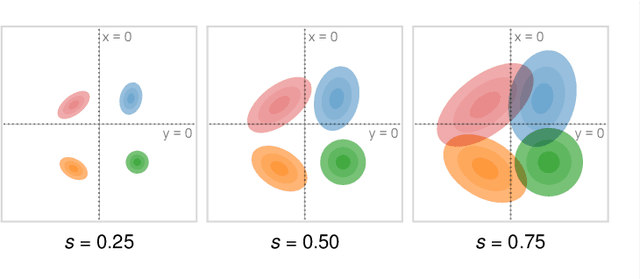
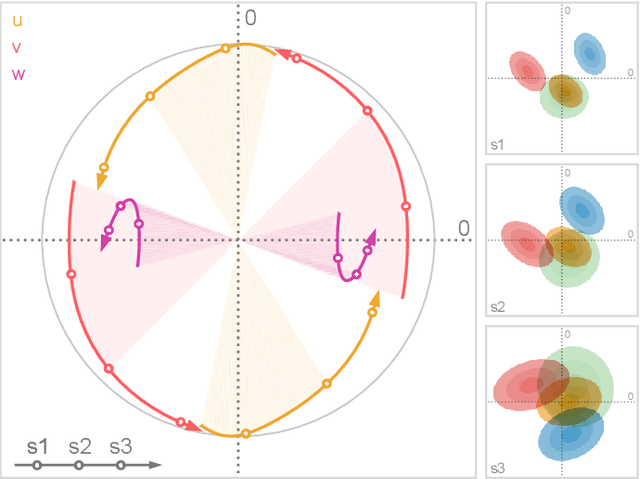
Abstract:We present a technique to perform dimensionality reduction on data that is subject to uncertainty. Our method is a generalization of traditional principal component analysis (PCA) to multivariate probability distributions. In comparison to non-linear methods, linear dimensionality reduction techniques have the advantage that the characteristics of such probability distributions remain intact after projection. We derive a representation of the covariance matrix that respects potential uncertainty in each of the observations, building the mathematical foundation of our new method uncertainty-aware PCA. In addition to the accuracy and performance gained by our approach over sampling-based strategies, our formulation allows us to perform sensitivity analysis with regard to the uncertainty in the data. For this, we propose factor traces as a novel visualization that enables us to better understand the influence of uncertainty on the chosen principal components. We provide multiple examples of our technique using real-world datasets and show how to propagate multivariate normal distributions through PCA in closed-form. Furthermore, we discuss extensions and limitations of our approach.
 Add to Chrome
 Add to Firefox
 Add to Edge