Anjul Tyagi
Visualization and Optimization Techniques for High Dimensional Parameter Spaces
Apr 28, 2022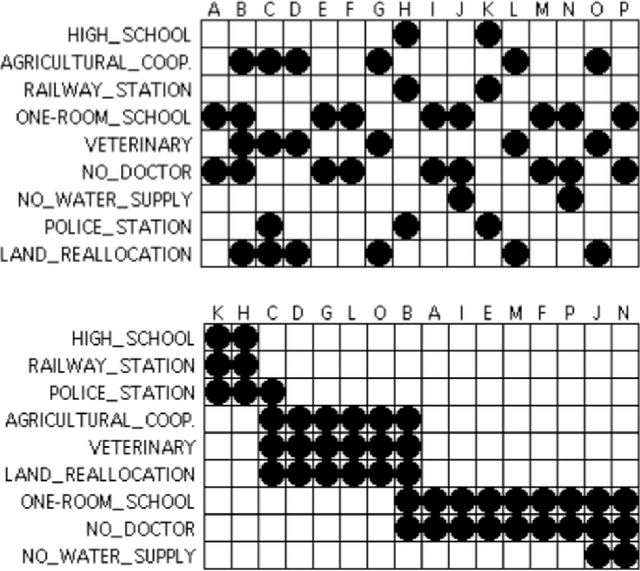

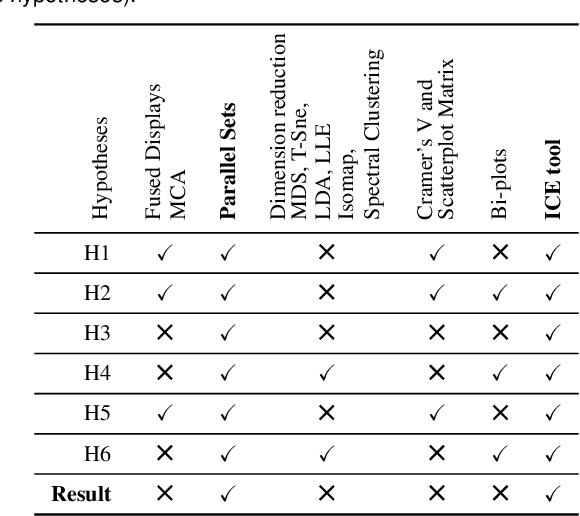
Abstract:High dimensional parameter space optimization is crucial in many applications. The parameters affecting this performance can be both numerical and categorical in their type. The existing techniques of black-box optimization and visual analytics are good in dealing with numerical parameters but analyzing categorical variables in context of the numerical variables are not well studied. Hence, we propose a novel approach, to create an auto-tuning framework for storage systems optimization combining both direct optimization techniques and visual analytics research. While the optimization algorithm will be the core of the system, visual analytics will provide a guideline with the help of an external agent (expert) to provide crucial hints to narrow down the large search space for the optimization engine. As part of the initial step towards creating an auto-tuning engine for storage systems optimization, we created an Interactive Configuration Explorer \textit{ICE}, which directly addresses the need of analysts to learn how the dependent numerical variable is affected by the parameter settings given multiple optimization objectives. No information is lost as ICE shows the complete distribution and statistics of the dependent variable in context with each categorical variable. Analysts can interactively filter the variables to optimize for certain goals such as achieving a system with maximum performance, low variance, etc. Our system was developed in tight collaboration with a group of systems performance researchers and its final effectiveness was evaluated with expert interviews, a comparative user study, and two case studies. We also discuss our research plan for creating an efficient auto-tuning framework combining black-box optimization and visual analytics for storage systems performance optimization.
Infographics Wizard: Flexible Infographics Authoring and Design Exploration
Apr 21, 2022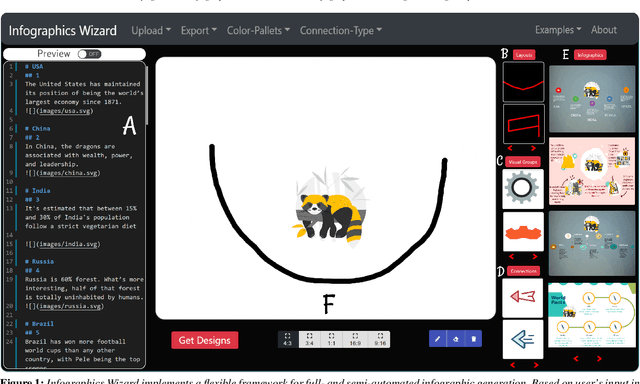
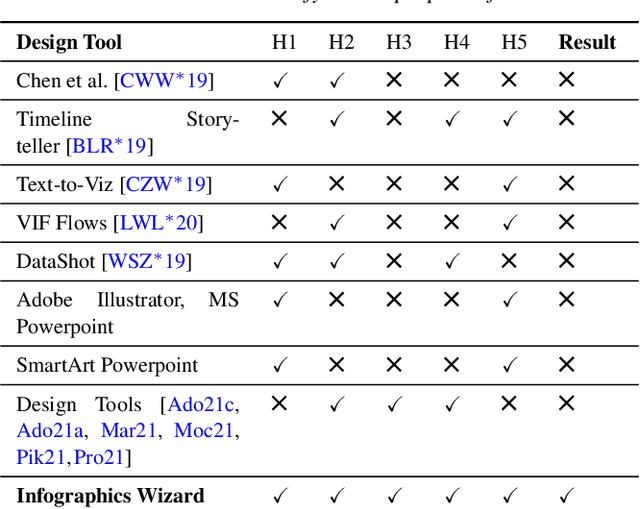
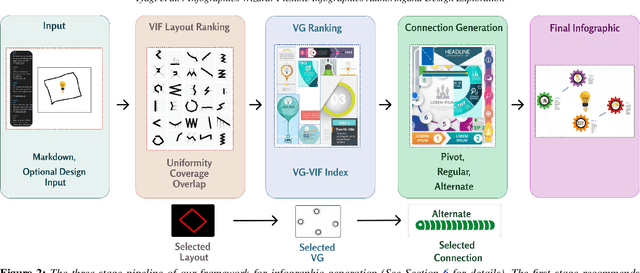
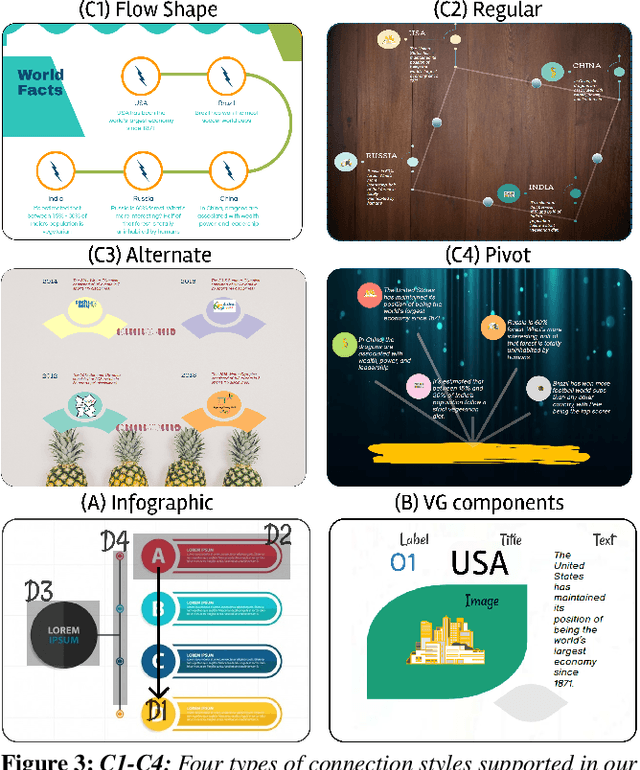
Abstract:Infographics are an aesthetic visual representation of information following specific design principles of human perception. Designing infographics can be a tedious process for non-experts and time-consuming, even for professional designers. With the help of designers, we propose a semi-automated infographic framework for general structured and flow-based infographic design generation. For novice designers, our framework automatically creates and ranks infographic designs for a user-provided text with no requirement for design input. However, expert designers can still provide custom design inputs to customize the infographics. We will also contribute an individual visual group (VG) designs dataset (in SVG), along with a 1k complete infographic image dataset with segmented VGs in this work. Evaluation results confirm that by using our framework, designers from all expertise levels can generate generic infographic designs faster than existing methods while maintaining the same quality as hand-designed infographics templates.
User-Centric Semi-Automated Infographics Authoring and Recommendation
Aug 27, 2021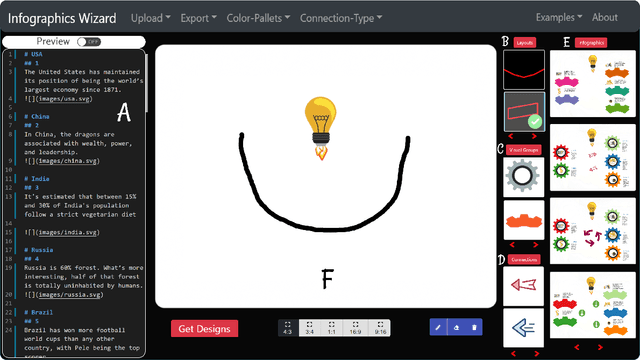
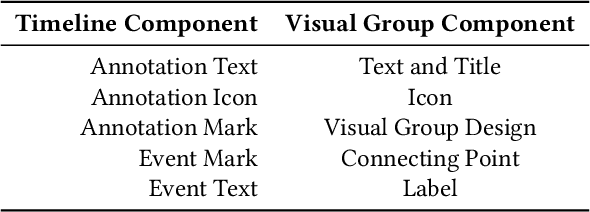
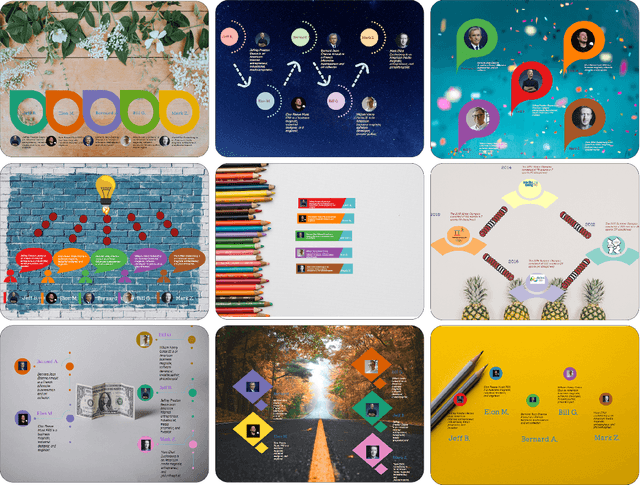

Abstract:Designing infographics can be a tedious process for non-experts and time-consuming even for professional designers. Based on the literature and a formative study, we propose a flexible framework for automated and semi-automated infographics design. This framework captures the main design components in infographics and streamlines the generation workflow into three steps, allowing users to control and optimize each aspect independently. Based on the framework, we also propose an interactive tool, \name{}, for assisting novice designers with creating high-quality infographics from an input in a markdown format by offering recommendations of different design components of infographics. Simultaneously, more experienced designers can provide custom designs and layout ideas to the tool using a canvas to control the automated generation process partially. As part of our work, we also contribute an individual visual group (VG) and connection designs dataset (in SVG), along with a 1k complete infographic image dataset with segmented VGs. This dataset plays a crucial role in diversifying the infographic designs created by our framework. We evaluate our approach with a comparison against similar tools, a user study with novice and expert designers, and a case study. Results confirm that our framework and \name{} excel in creating customized infographics and exploring a large variety of designs.
Visual Steering for One-Shot Deep Neural Network Synthesis
Sep 28, 2020


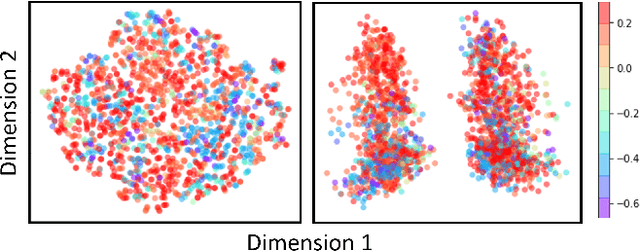
Abstract:Recent advancements in the area of deep learning have shown the effectiveness of very large neural networks in several applications. However, as these deep neural networks continue to grow in size, it becomes more and more difficult to configure their many parameters to obtain good results. Presently, analysts must experiment with many different configurations and parameter settings, which is labor-intensive and time-consuming. On the other hand, the capacity of fully automated techniques for neural network architecture search is limited without the domain knowledge of human experts. To deal with the problem, we formulate the task of neural network architecture optimization as a graph space exploration, based on the one-shot architecture search technique. In this approach, a super-graph of all candidate architectures is trained in one-shot and the optimal neural network is identified as a sub-graph. In this paper, we present a framework that allows analysts to effectively build the solution sub-graph space and guide the network search by injecting their domain knowledge. Starting with the network architecture space composed of basic neural network components, analysts are empowered to effectively select the most promising components via our one-shot search scheme. Applying this technique in an iterative manner allows analysts to converge to the best performing neural network architecture for a given application. During the exploration, analysts can use their domain knowledge aided by cues provided from a scatterplot visualization of the search space to edit different components and guide the search for faster convergence. We designed our interface in collaboration with several deep learning researchers and its final effectiveness is evaluated with a user study and two case studies.
Task Classification Model for Visual Fixation, Exploration, and Search
Jul 29, 2019
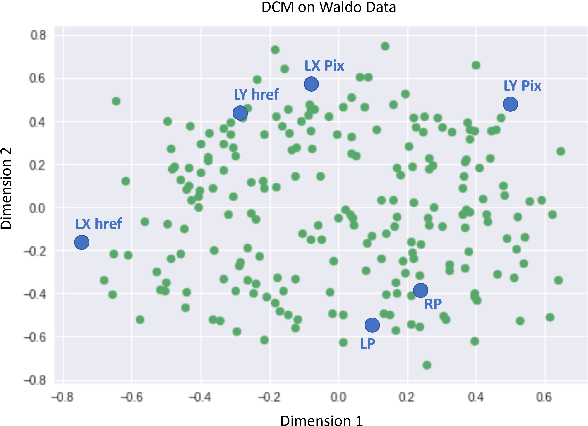
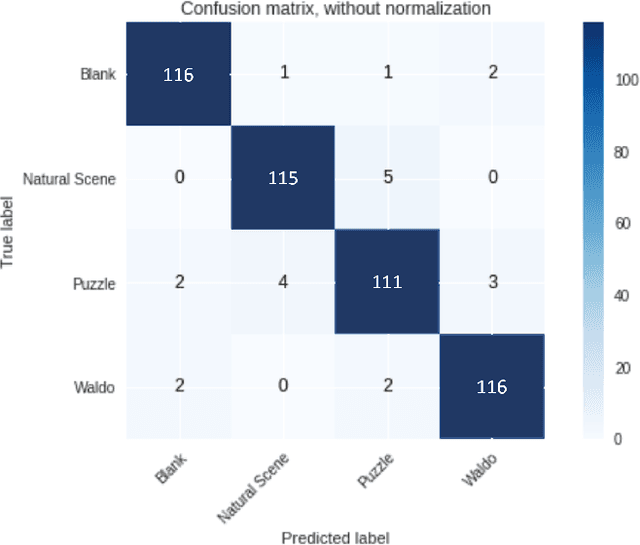
Abstract:Yarbus' claim to decode the observer's task from eye movements has received mixed reactions. In this paper, we have supported the hypothesis that it is possible to decode the task. We conducted an exploratory analysis on the dataset by projecting features and data points into a scatter plot to visualize the nuance properties for each task. Following this analysis, we eliminated highly correlated features before training an SVM and Ada Boosting classifier to predict the tasks from this filtered eye movements data. We achieve an accuracy of 95.4% on this task classification problem and hence, support the hypothesis that task classification is possible from a user's eye movement data.
* 4 pages
 Add to Chrome
 Add to Firefox
 Add to Edge