Danqing Shi
DataScout: Automatic Data Fact Retrieval for Statement Augmentation with an LLM-Based Agent
Apr 24, 2025
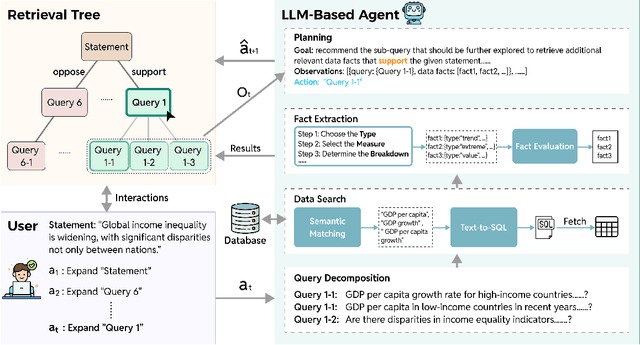
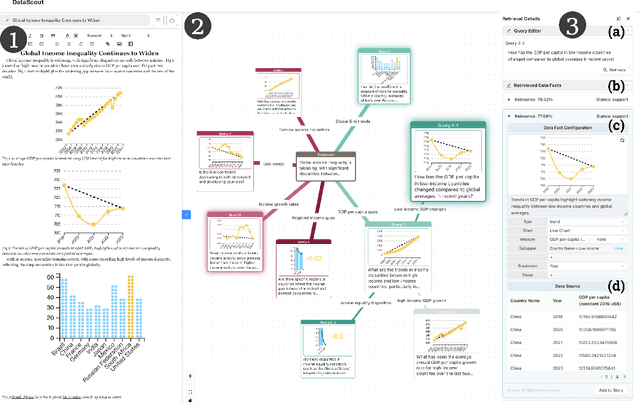
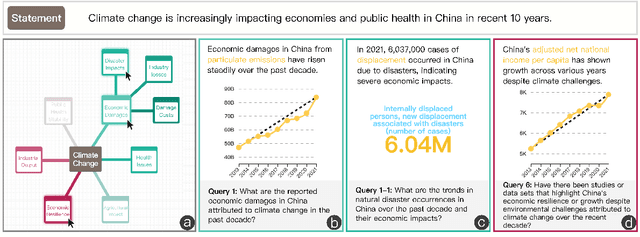
Abstract:A data story typically integrates data facts from multiple perspectives and stances to construct a comprehensive and objective narrative. However, retrieving these facts demands time for data search and challenges the creator's analytical skills. In this work, we introduce DataScout, an interactive system that automatically performs reasoning and stance-based data facts retrieval to augment the user's statement. Particularly, DataScout leverages an LLM-based agent to construct a retrieval tree, enabling collaborative control of its expansion between users and the agent. The interface visualizes the retrieval tree as a mind map that eases users to intuitively steer the retrieval direction and effectively engage in reasoning and analysis. We evaluate the proposed system through case studies and in-depth expert interviews. Our evaluation demonstrates that DataScout can effectively retrieve multifaceted data facts from different stances, helping users verify their statements and enhance the credibility of their stories.
Gen4DS: Workshop on Data Storytelling in an Era of Generative AI
Apr 06, 2024Abstract:Storytelling is an ancient and precious human ability that has been rejuvenated in the digital age. Over the last decade, there has been a notable surge in the recognition and application of data storytelling, both in academia and industry. Recently, the rapid development of generative AI has brought new opportunities and challenges to this field, sparking numerous new questions. These questions may not necessarily be quickly transformed into papers, but we believe it is necessary to promptly discuss them to help the community better clarify important issues and research agendas for the future. We thus invite you to join our workshop (Gen4DS) to discuss questions such as: How can generative AI facilitate the creation of data stories? How might generative AI alter the workflow of data storytellers? What are the pitfalls and risks of incorporating AI in storytelling? We have designed both paper presentations and interactive activities (including hands-on creation, group discussion pods, and debates on controversial issues) for the workshop. We hope that participants will learn about the latest advances and pioneering work in data storytelling, engage in critical conversations with each other, and have an enjoyable, unforgettable, and meaningful experience at the event.
Task-Oriented Optimal Sequencing of Visualization Charts
Aug 07, 2019
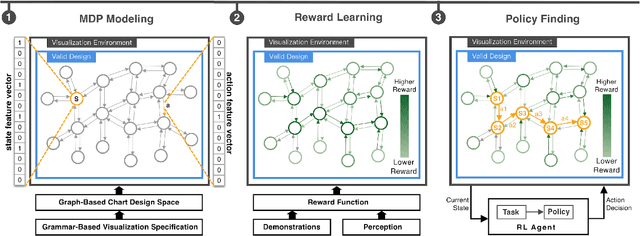
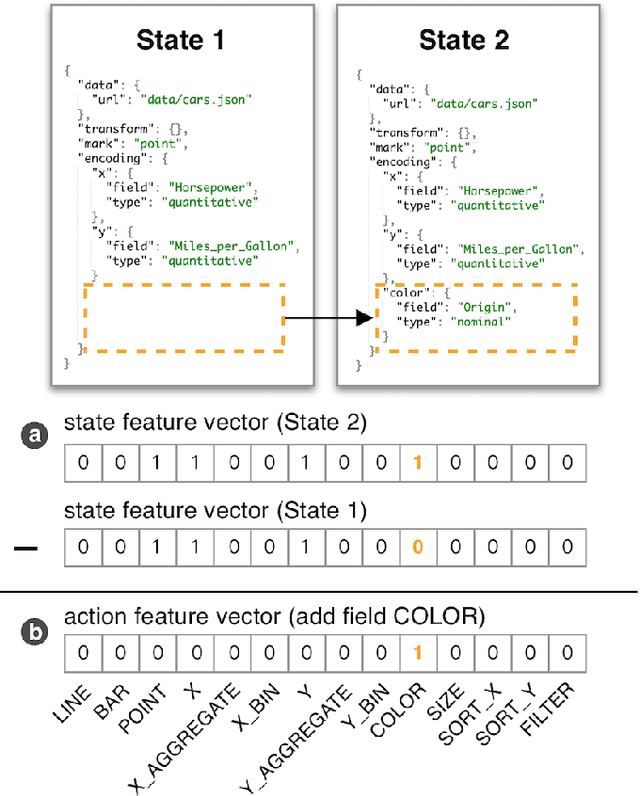
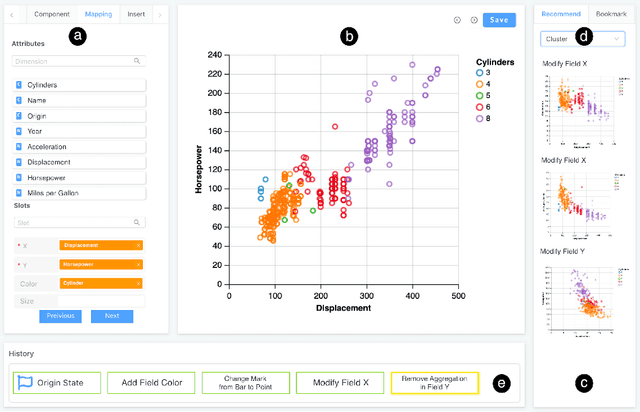
Abstract:A chart sequence is used to describe a series of visualization charts generated in the exploratory analysis by data analysts. It provides information details in each chart as well as a logical relationship among charts. While existing research targets on generating chart sequences that match human's perceptions, little attention has been paid to formulate task-oriented connections between charts in a chart design space. We present a novel chart sequencing method based on reinforcement learning to capture the connections between charts in the context of three major analysis tasks, including correlation analysis, anomaly detection, and cluster analysis. The proposed method formulates a chart sequencing procedure as an optimization problem, which seeks an optimal policy to sequencing charts for the specific analysis task. In our method, a novel reward function is introduced, which takes both the analysis task and the factor of human cognition into consideration. We conducted one case study and two user studies to evaluate the effectiveness of our method under the application scenarios of visualization demonstration, sequencing charts for reasoning analysis results, and making a chart design choice. The study results showed the power of our method.
 Add to Chrome
 Add to Firefox
 Add to Edge