Weikai Yang
Structural-Entropy-Based Sample Selection for Efficient and Effective Learning
Oct 03, 2024


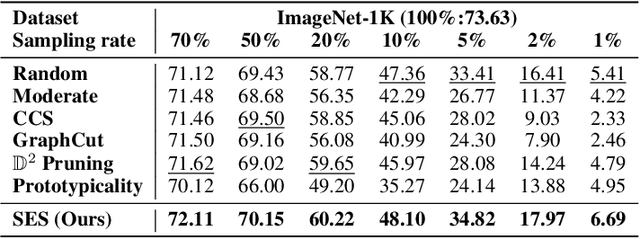
Abstract:Sample selection improves the efficiency and effectiveness of machine learning models by providing informative and representative samples. Typically, samples can be modeled as a sample graph, where nodes are samples and edges represent their similarities. Most existing methods are based on local information, such as the training difficulty of samples, thereby overlooking global information, such as connectivity patterns. This oversight can result in suboptimal selection because global information is crucial for ensuring that the selected samples well represent the structural properties of the graph. To address this issue, we employ structural entropy to quantify global information and losslessly decompose it from the whole graph to individual nodes using the Shapley value. Based on the decomposition, we present $\textbf{S}$tructural-$\textbf{E}$ntropy-based sample $\textbf{S}$election ($\textbf{SES}$), a method that integrates both global and local information to select informative and representative samples. SES begins by constructing a $k$NN-graph among samples based on their similarities. It then measures sample importance by combining structural entropy (global metric) with training difficulty (local metric). Finally, SES applies importance-biased blue noise sampling to select a set of diverse and representative samples. Comprehensive experiments on three learning scenarios -- supervised learning, active learning, and continual learning -- clearly demonstrate the effectiveness of our method.
A Scalable Matrix Visualization for Understanding Tree Ensemble Classifiers
Sep 05, 2024


Abstract:The high performance of tree ensemble classifiers benefits from a large set of rules, which, in turn, makes the models hard to understand. To improve interpretability, existing methods extract a subset of rules for approximation using model reduction techniques. However, by focusing on the reduced rule set, these methods often lose fidelity and ignore anomalous rules that, despite their infrequency, play crucial roles in real-world applications. This paper introduces a scalable visual analysis method to explain tree ensemble classifiers that contain tens of thousands of rules. The key idea is to address the issue of losing fidelity by adaptively organizing the rules as a hierarchy rather than reducing them. To ensure the inclusion of anomalous rules, we develop an anomaly-biased model reduction method to prioritize these rules at each hierarchical level. Synergized with this hierarchical organization of rules, we develop a matrix-based hierarchical visualization to support exploration at different levels of detail. Our quantitative experiments and case studies demonstrate how our method fosters a deeper understanding of both common and anomalous rules, thereby enhancing interpretability without sacrificing comprehensiveness.
Foundation Models Meet Visualizations: Challenges and Opportunities
Oct 09, 2023


Abstract:Recent studies have indicated that foundation models, such as BERT and GPT, excel in adapting to a variety of downstream tasks. This adaptability has established them as the dominant force in building artificial intelligence (AI) systems. As visualization techniques intersect with these models, a new research paradigm emerges. This paper divides these intersections into two main areas: visualizations for foundation models (VIS4FM) and foundation models for visualizations (FM4VIS). In VIS4FM, we explore the primary role of visualizations in understanding, refining, and evaluating these intricate models. This addresses the pressing need for transparency, explainability, fairness, and robustness. Conversely, within FM4VIS, we highlight how foundation models can be utilized to advance the visualization field itself. The confluence of foundation models and visualizations holds great promise, but it also comes with its own set of challenges. By highlighting these challenges and the growing opportunities, this paper seeks to provide a starting point for continued exploration in this promising avenue.
A Unified Interactive Model Evaluation for Classification, Object Detection, and Instance Segmentation in Computer Vision
Aug 09, 2023


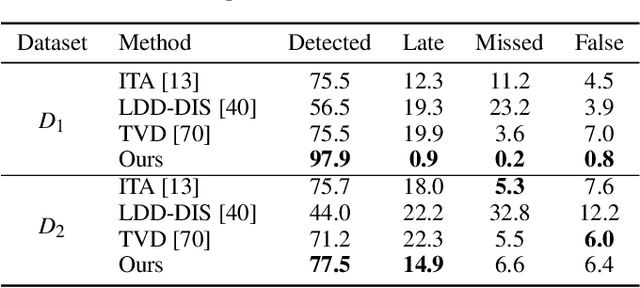
Abstract:Existing model evaluation tools mainly focus on evaluating classification models, leaving a gap in evaluating more complex models, such as object detection. In this paper, we develop an open-source visual analysis tool, Uni-Evaluator, to support a unified model evaluation for classification, object detection, and instance segmentation in computer vision. The key idea behind our method is to formulate both discrete and continuous predictions in different tasks as unified probability distributions. Based on these distributions, we develop 1) a matrix-based visualization to provide an overview of model performance; 2) a table visualization to identify the problematic data subsets where the model performs poorly; 3) a grid visualization to display the samples of interest. These visualizations work together to facilitate the model evaluation from a global overview to individual samples. Two case studies demonstrate the effectiveness of Uni-Evaluator in evaluating model performance and making informed improvements.
A Unified Understanding of Deep NLP Models for Text Classification
Jun 19, 2022


Abstract:The rapid development of deep natural language processing (NLP) models for text classification has led to an urgent need for a unified understanding of these models proposed individually. Existing methods cannot meet the need for understanding different models in one framework due to the lack of a unified measure for explaining both low-level (e.g., words) and high-level (e.g., phrases) features. We have developed a visual analysis tool, DeepNLPVis, to enable a unified understanding of NLP models for text classification. The key idea is a mutual information-based measure, which provides quantitative explanations on how each layer of a model maintains the information of input words in a sample. We model the intra- and inter-word information at each layer measuring the importance of a word to the final prediction as well as the relationships between words, such as the formation of phrases. A multi-level visualization, which consists of a corpus-level, a sample-level, and a word-level visualization, supports the analysis from the overall training set to individual samples. Two case studies on classification tasks and comparison between models demonstrate that DeepNLPVis can help users effectively identify potential problems caused by samples and model architectures and then make informed improvements.
Diagnosing Ensemble Few-Shot Classifiers
Jun 09, 2022


Abstract:The base learners and labeled samples (shots) in an ensemble few-shot classifier greatly affect the model performance. When the performance is not satisfactory, it is usually difficult to understand the underlying causes and make improvements. To tackle this issue, we propose a visual analysis method, FSLDiagnotor. Given a set of base learners and a collection of samples with a few shots, we consider two problems: 1) finding a subset of base learners that well predict the sample collections; and 2) replacing the low-quality shots with more representative ones to adequately represent the sample collections. We formulate both problems as sparse subset selection and develop two selection algorithms to recommend appropriate learners and shots, respectively. A matrix visualization and a scatterplot are combined to explain the recommended learners and shots in context and facilitate users in adjusting them. Based on the adjustment, the algorithm updates the recommendation results for another round of improvement. Two case studies are conducted to demonstrate that FSLDiagnotor helps build a few-shot classifier efficiently and increases the accuracy by 12% and 21%, respectively.
Interactive Steering of Hierarchical Clustering
Sep 21, 2020


Abstract:Hierarchical clustering is an important technique to organize big data for exploratory data analysis. However, existing one-size-fits-all hierarchical clustering methods often fail to meet the diverse needs of different users. To address this challenge, we present an interactive steering method to visually supervise constrained hierarchical clustering by utilizing both public knowledge (e.g., Wikipedia) and private knowledge from users. The novelty of our approach includes 1) automatically constructing constraints for hierarchical clustering using knowledge (knowledge-driven) and intrinsic data distribution (data-driven), and 2) enabling the interactive steering of clustering through a visual interface (user-driven). Our method first maps each data item to the most relevant items in a knowledge base. An initial constraint tree is then extracted using the ant colony optimization algorithm. The algorithm balances the tree width and depth and covers the data items with high confidence. Given the constraint tree, the data items are hierarchically clustered using evolutionary Bayesian rose tree. To clearly convey the hierarchical clustering results, an uncertainty-aware tree visualization has been developed to enable users to quickly locate the most uncertain sub-hierarchies and interactively improve them. The quantitative evaluation and case study demonstrate that the proposed approach facilitates the building of customized clustering trees in an efficient and effective manner.
Diagnosing Concept Drift with Visual Analytics
Jul 29, 2020


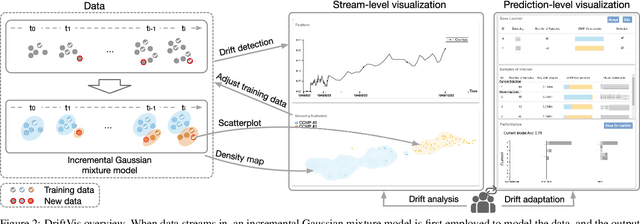
Abstract:Concept drift is a phenomenon in which the distribution of a data stream changes over time in unforeseen ways, causing prediction models built on historical data to become inaccurate. While a variety of automated methods have been developed to identify when concept drift occurs, there is limited support for analysts who need to understand and correct their models when drift is detected. In this paper, we present a visual analytics method, DriftVis, to support model builders and analysts in the identification and correction of concept drift in streaming data. DriftVis combines a distribution-based drift detection method with a streaming scatterplot to support the analysis of drift caused by the distribution changes of data streams and to explore the impact of these changes on the model's accuracy. Two case studies on weather prediction and text classification have been conducted to demonstrate our proposed tool and illustrate how visual analytics can be used to support the detection, examination, and correction of concept drift.
 Add to Chrome
 Add to Firefox
 Add to Edge