Enrico Bertini
Visual Exploration of Machine Learning Model Behavior with Hierarchical Surrogate Rule Sets
Jan 19, 2022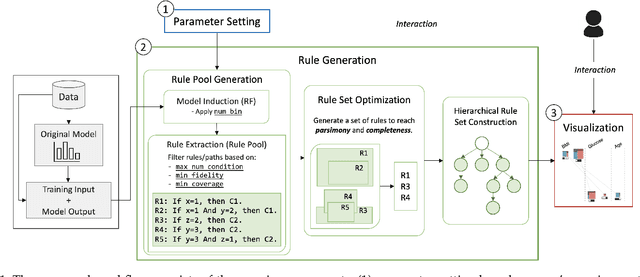
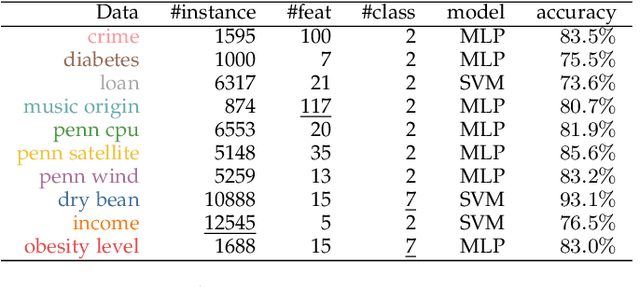
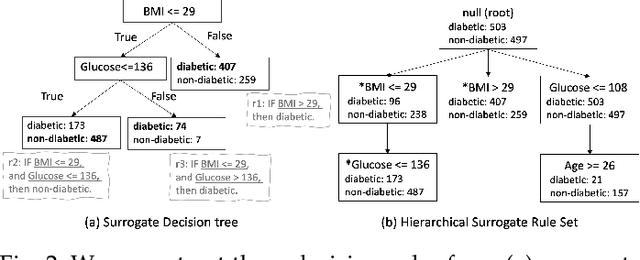

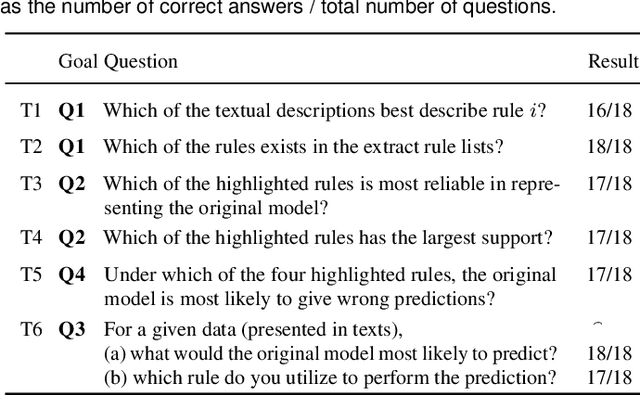
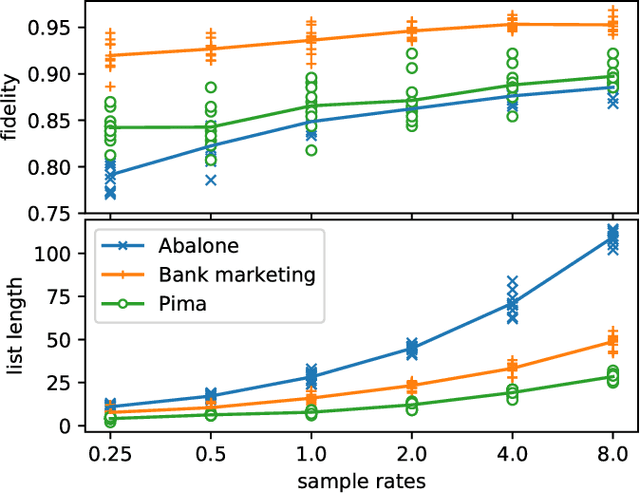
Abstract:One of the potential solutions for model interpretation is to train a surrogate model: a more transparent model that approximates the behavior of the model to be explained. Typically, classification rules or decision trees are used due to the intelligibility of their logic-based expressions. However, decision trees can grow too deep and rule sets can become too large to approximate a complex model. Unlike paths on a decision tree that must share ancestor nodes (conditions), rules are more flexible. However, the unstructured visual representation of rules makes it hard to make inferences across rules. To address these issues, we present a workflow that includes novel algorithmic and interactive solutions. First, we present Hierarchical Surrogate Rules (HSR), an algorithm that generates hierarchical rules based on user-defined parameters. We also contribute SuRE, a visual analytics (VA) system that integrates HSR and interactive surrogate rule visualizations. Particularly, we present a novel feature-aligned tree to overcome the shortcomings of existing rule visualizations. We evaluate the algorithm in terms of parameter sensitivity, time performance, and comparison with surrogate decision trees and find that it scales reasonably well and outperforms decision trees in many respects. We also evaluate the visualization and the VA system by a usability study with 24 volunteers and an observational study with 7 domain experts. Our investigation shows that the participants can use feature-aligned trees to perform non-trivial tasks with very high accuracy. We also discuss many interesting observations that can be useful for future research on designing effective rule-based VA systems.
An Exploration And Validation of Visual Factors in Understanding Classification Rule Sets
Sep 19, 2021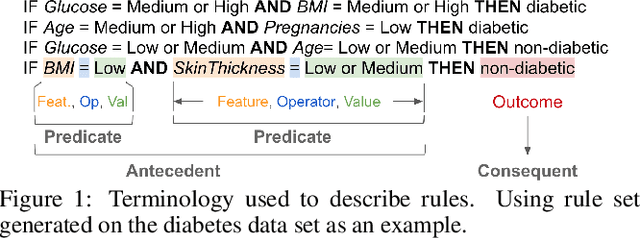
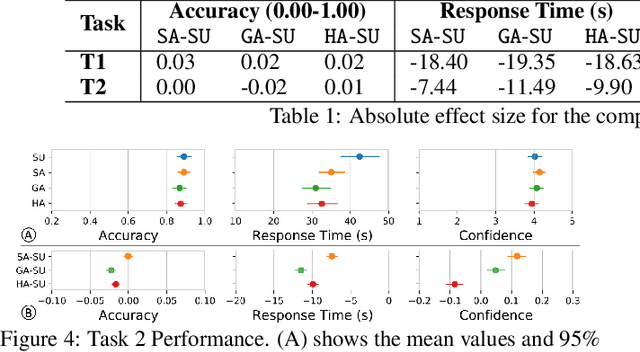
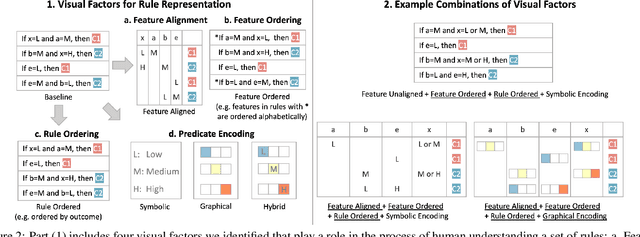

Abstract:Rule sets are often used in Machine Learning (ML) as a way to communicate the model logic in settings where transparency and intelligibility are necessary. Rule sets are typically presented as a text-based list of logical statements (rules). Surprisingly, to date there has been limited work on exploring visual alternatives for presenting rules. In this paper, we explore the idea of designing alternative representations of rules, focusing on a number of visual factors we believe have a positive impact on rule readability and understanding. We then presents a user study exploring their impact. The results show that some design factors have a strong impact on how efficiently readers can process the rules while having minimal impact on accuracy. This work can help practitioners employ more effective solutions when using rules as a communication strategy to understand ML models.
AdViCE: Aggregated Visual Counterfactual Explanations for Machine Learning Model Validation
Sep 12, 2021
Abstract:Rapid improvements in the performance of machine learning models have pushed them to the forefront of data-driven decision-making. Meanwhile, the increased integration of these models into various application domains has further highlighted the need for greater interpretability and transparency. To identify problems such as bias, overfitting, and incorrect correlations, data scientists require tools that explain the mechanisms with which these model decisions are made. In this paper we introduce AdViCE, a visual analytics tool that aims to guide users in black-box model debugging and validation. The solution rests on two main visual user interface innovations: (1) an interactive visualization design that enables the comparison of decisions on user-defined data subsets; (2) an algorithm and visual design to compute and visualize counterfactual explanations - explanations that depict model outcomes when data features are perturbed from their original values. We provide a demonstration of the tool through a use case that showcases the capabilities and potential limitations of the proposed approach.
Visualizing Rule Sets: Exploration and Validation of a Design Space
Mar 04, 2021
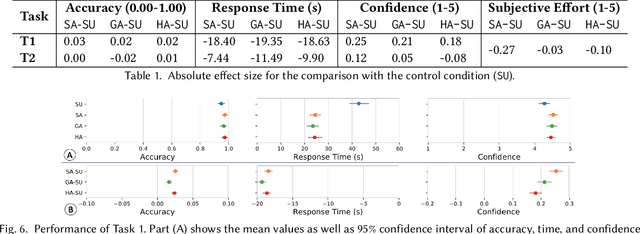
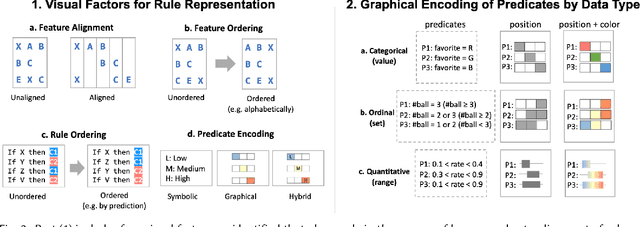

Abstract:Rule sets are often used in Machine Learning (ML) as a way to communicate the model logic in settings where transparency and intelligibility are necessary. Rule sets are typically presented as a text-based list of logical statements (rules). Surprisingly, to date there has been limited work on exploring visual alternatives for presenting rules. In this paper, we explore the idea of designing alternative representations of rules, focusing on a number of visual factors we believe have a positive impact on rule readability and understanding. The paper presents an initial design space for visualizing rule sets and a user study exploring their impact. The results show that some design factors have a strong impact on how efficiently readers can process the rules while having minimal impact on accuracy. This work can help practitioners employ more effective solutions when using rules as a communication strategy to understand ML models.
Towards Ground Truth Explainability on Tabular Data
Jul 20, 2020


Abstract:In data science, there is a long history of using synthetic data for method development, feature selection and feature engineering. Our current interest in synthetic data comes from recent work in explainability. Today's datasets are typically larger and more complex - requiring less interpretable models. In the setting of \textit{post hoc} explainability, there is no ground truth for explanations. Inspired by recent work in explaining image classifiers that does provide ground truth, we propose a similar solution for tabular data. Using copulas, a concise specification of the desired statistical properties of a dataset, users can build intuition around explainability using controlled data sets and experimentation. The current capabilities are demonstrated on three use cases: one dimensional logistic regression, impact of correlation from informative features, impact of correlation from redundant variables.
Human Factors in Model Interpretability: Industry Practices, Challenges, and Needs
May 30, 2020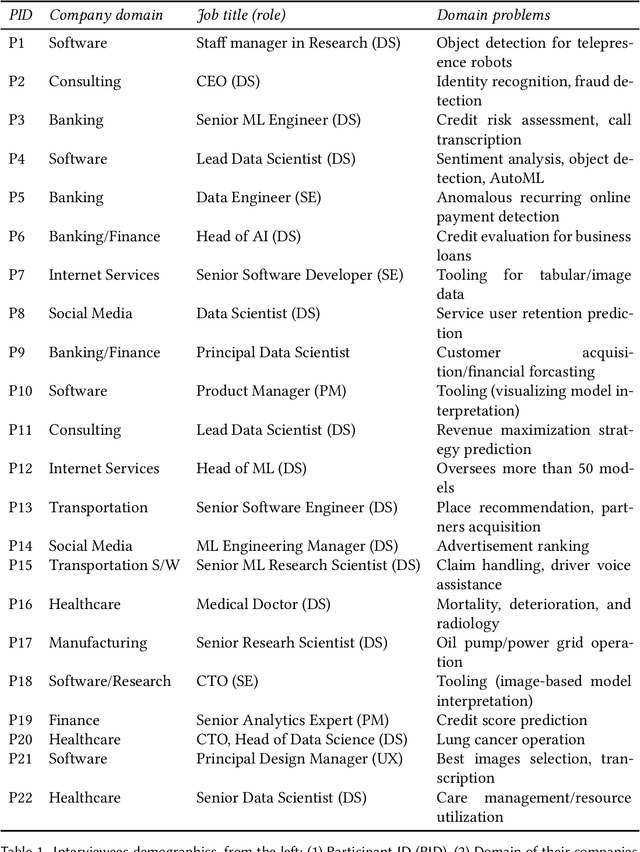
Abstract:As the use of machine learning (ML) models in product development and data-driven decision-making processes became pervasive in many domains, people's focus on building a well-performing model has increasingly shifted to understanding how their model works. While scholarly interest in model interpretability has grown rapidly in research communities like HCI, ML, and beyond, little is known about how practitioners perceive and aim to provide interpretability in the context of their existing workflows. This lack of understanding of interpretability as practiced may prevent interpretability research from addressing important needs, or lead to unrealistic solutions. To bridge this gap, we conducted 22 semi-structured interviews with industry practitioners to understand how they conceive of and design for interpretability while they plan, build, and use their models. Based on a qualitative analysis of our results, we differentiate interpretability roles, processes, goals and strategies as they exist within organizations making heavy use of ML models. The characterization of interpretability work that emerges from our analysis suggests that model interpretability frequently involves cooperation and mental model comparison between people in different roles, often aimed at building trust not only between people and models but also between people within the organization. We present implications for design that discuss gaps between the interpretability challenges that practitioners face in their practice and approaches proposed in the literature, highlighting possible research directions that can better address real-world needs.
ViCE: Visual Counterfactual Explanations for Machine Learning Models
Mar 05, 2020

Abstract:The continued improvements in the predictive accuracy of machine learning models have allowed for their widespread practical application. Yet, many decisions made with seemingly accurate models still require verification by domain experts. In addition, end-users of a model also want to understand the reasons behind specific decisions. Thus, the need for interpretability is increasingly paramount. In this paper we present an interactive visual analytics tool, ViCE, that generates counterfactual explanations to contextualize and evaluate model decisions. Each sample is assessed to identify the minimal set of changes needed to flip the model's output. These explanations aim to provide end-users with personalized actionable insights with which to understand, and possibly contest or improve, automated decisions. The results are effectively displayed in a visual interface where counterfactual explanations are highlighted and interactive methods are provided for users to explore the data and model. The functionality of the tool is demonstrated by its application to a home equity line of credit dataset.
Visus: An Interactive System for Automatic Machine Learning Model Building and Curation
Jul 05, 2019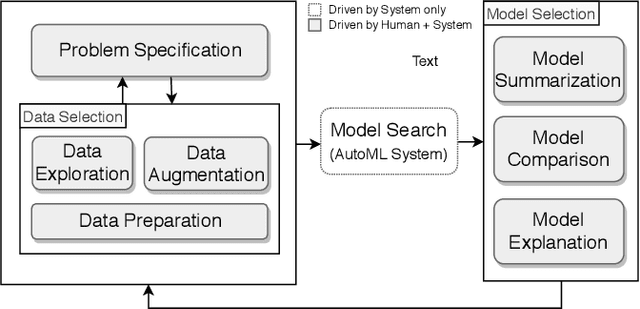
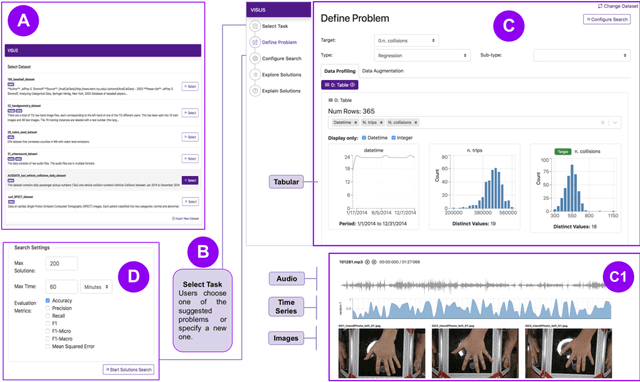
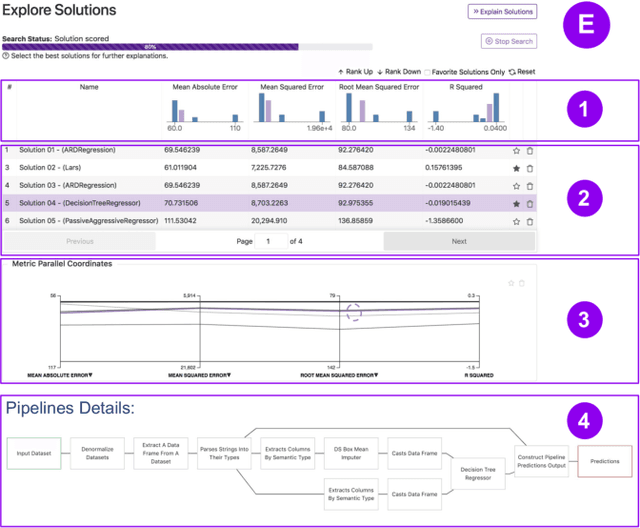
Abstract:While the demand for machine learning (ML) applications is booming, there is a scarcity of data scientists capable of building such models. Automatic machine learning (AutoML) approaches have been proposed that help with this problem by synthesizing end-to-end ML data processing pipelines. However, these follow a best-effort approach and a user in the loop is necessary to curate and refine the derived pipelines. Since domain experts often have little or no expertise in machine learning, easy-to-use interactive interfaces that guide them throughout the model building process are necessary. In this paper, we present Visus, a system designed to support the model building process and curation of ML data processing pipelines generated by AutoML systems. We describe the framework used to ground our design choices and a usage scenario enabled by Visus. Finally, we discuss the feedback received in user testing sessions with domain experts.
RuleMatrix: Visualizing and Understanding Classifiers with Rules
Jul 17, 2018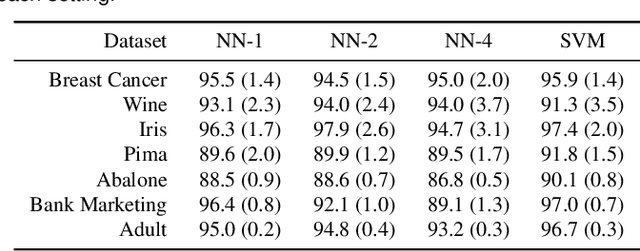

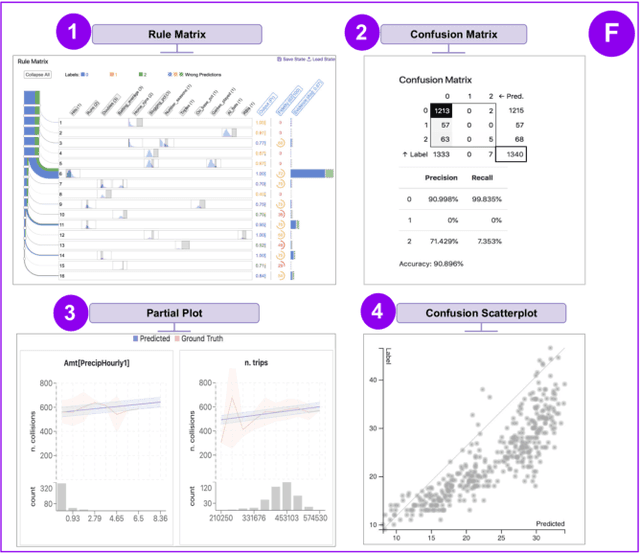
Abstract:With the growing adoption of machine learning techniques, there is a surge of research interest towards making machine learning systems more transparent and interpretable. Various visualizations have been developed to help model developers understand, diagnose, and refine machine learning models. However, a large number of potential but neglected users are the domain experts with little knowledge of machine learning but are expected to work with machine learning systems. In this paper, we present an interactive visualization technique to help users with little expertise in machine learning to understand, explore and validate predictive models. By viewing the model as a black box, we extract a standardized rule-based knowledge representation from its input-output behavior. We design RuleMatrix, a matrix-based visualization of rules to help users navigate and verify the rules and the black-box model. We evaluate the effectiveness of RuleMatrix via two use cases and a usability study.
A Workflow for Visual Diagnostics of Binary Classifiers using Instance-Level Explanations
Oct 01, 2017
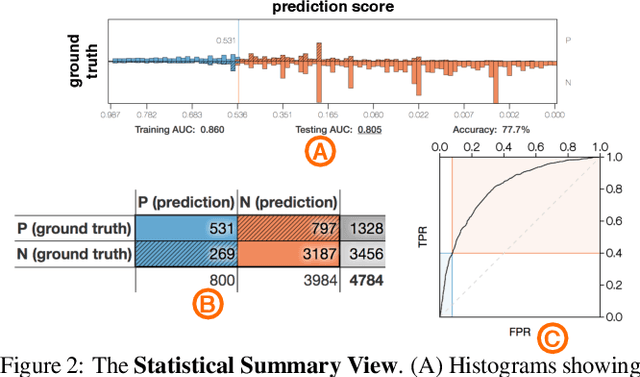
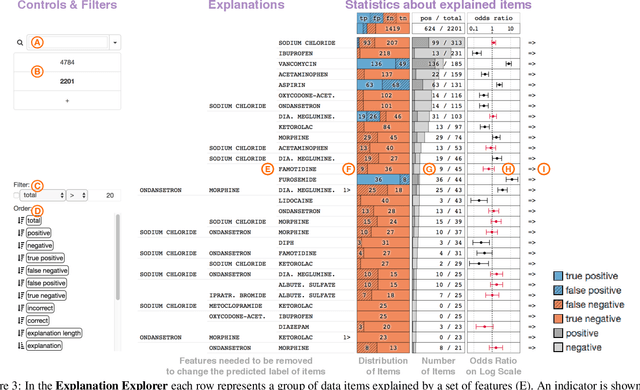
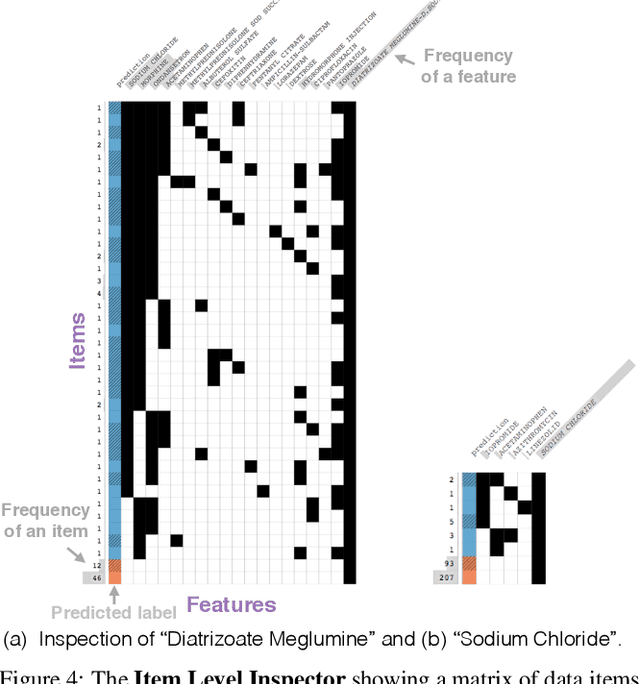
Abstract:Human-in-the-loop data analysis applications necessitate greater transparency in machine learning models for experts to understand and trust their decisions. To this end, we propose a visual analytics workflow to help data scientists and domain experts explore, diagnose, and understand the decisions made by a binary classifier. The approach leverages "instance-level explanations", measures of local feature relevance that explain single instances, and uses them to build a set of visual representations that guide the users in their investigation. The workflow is based on three main visual representations and steps: one based on aggregate statistics to see how data distributes across correct / incorrect decisions; one based on explanations to understand which features are used to make these decisions; and one based on raw data, to derive insights on potential root causes for the observed patterns. The workflow is derived from a long-term collaboration with a group of machine learning and healthcare professionals who used our method to make sense of machine learning models they developed. The case study from this collaboration demonstrates that the proposed workflow helps experts derive useful knowledge about the model and the phenomena it describes, thus experts can generate useful hypotheses on how a model can be improved.
 Add to Chrome
 Add to Firefox
 Add to Edge