Aritra Dasgupta
Fooling SHAP with Output Shuffling Attacks
Aug 12, 2024Abstract:Explainable AI~(XAI) methods such as SHAP can help discover feature attributions in black-box models. If the method reveals a significant attribution from a ``protected feature'' (e.g., gender, race) on the model output, the model is considered unfair. However, adversarial attacks can subvert the detection of XAI methods. Previous approaches to constructing such an adversarial model require access to underlying data distribution, which may not be possible in many practical scenarios. We relax this constraint and propose a novel family of attacks, called shuffling attacks, that are data-agnostic. The proposed attack strategies can adapt any trained machine learning model to fool Shapley value-based explanations. We prove that Shapley values cannot detect shuffling attacks. However, algorithms that estimate Shapley values, such as linear SHAP and SHAP, can detect these attacks with varying degrees of effectiveness. We demonstrate the efficacy of the attack strategies by comparing the performance of linear SHAP and SHAP using real-world datasets.
Who should I trust? A Visual Analytics Approach for Comparing Net Load Forecasting Models
Jul 31, 2024

Abstract:Net load forecasting is crucial for energy planning and facilitating informed decision-making regarding trade and load distributions. However, evaluating forecasting models' performance against benchmark models remains challenging, thereby impeding experts' trust in the model's performance. In this context, there is a demand for technological interventions that allow scientists to compare models across various timeframes and solar penetration levels. This paper introduces a visual analytics-based application designed to compare the performance of deep-learning-based net load forecasting models with other models for probabilistic net load forecasting. This application employs carefully selected visual analytic interventions, enabling users to discern differences in model performance across different solar penetration levels, dataset resolutions, and hours of the day over multiple months. We also present observations made using our application through a case study, demonstrating the effectiveness of visualizations in aiding scientists in making informed decisions and enhancing trust in net load forecasting models.
Interpretable Machine Learning for Weather and Climate Prediction: A Survey
Mar 24, 2024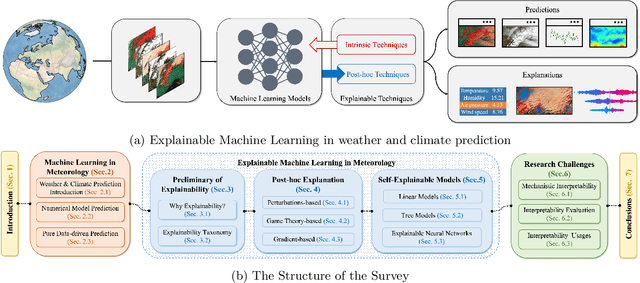

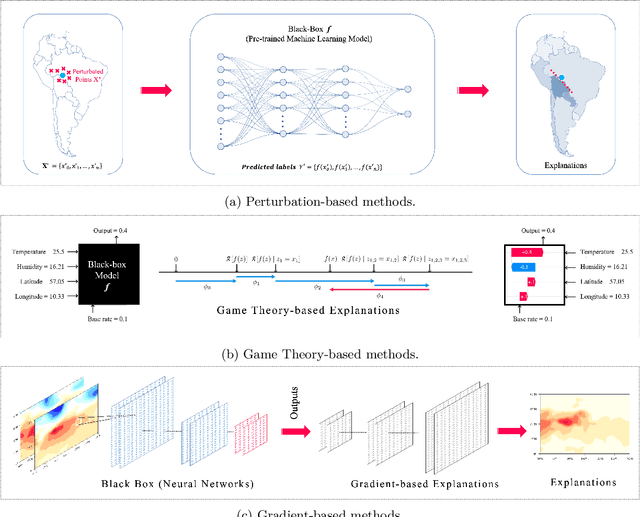
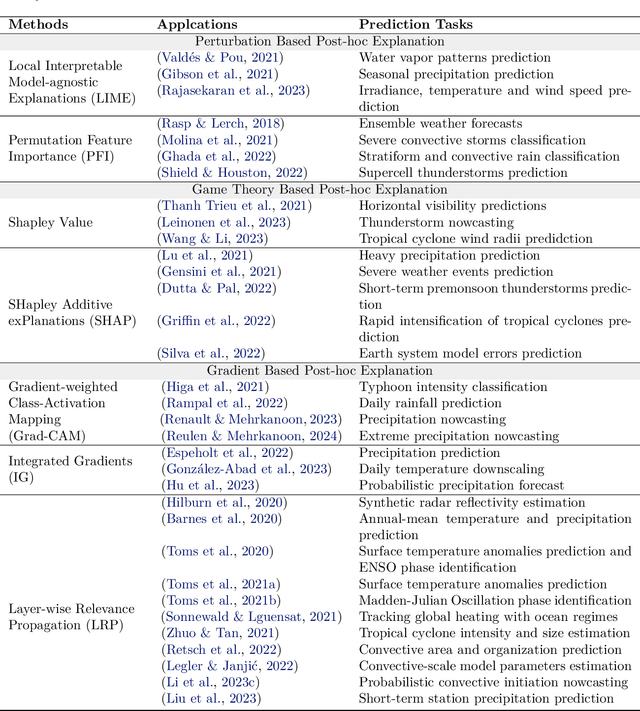
Abstract:Advanced machine learning models have recently achieved high predictive accuracy for weather and climate prediction. However, these complex models often lack inherent transparency and interpretability, acting as "black boxes" that impede user trust and hinder further model improvements. As such, interpretable machine learning techniques have become crucial in enhancing the credibility and utility of weather and climate modeling. In this survey, we review current interpretable machine learning approaches applied to meteorological predictions. We categorize methods into two major paradigms: 1) Post-hoc interpretability techniques that explain pre-trained models, such as perturbation-based, game theory based, and gradient-based attribution methods. 2) Designing inherently interpretable models from scratch using architectures like tree ensembles and explainable neural networks. We summarize how each technique provides insights into the predictions, uncovering novel meteorological relationships captured by machine learning. Lastly, we discuss research challenges around achieving deeper mechanistic interpretations aligned with physical principles, developing standardized evaluation benchmarks, integrating interpretability into iterative model development workflows, and providing explainability for large foundation models.
Forte: An Interactive Visual Analytic Tool for Trust-Augmented Net Load Forecasting
Nov 10, 2023

Abstract:Accurate net load forecasting is vital for energy planning, aiding decisions on trade and load distribution. However, assessing the performance of forecasting models across diverse input variables, like temperature and humidity, remains challenging, particularly for eliciting a high degree of trust in the model outcomes. In this context, there is a growing need for data-driven technological interventions to aid scientists in comprehending how models react to both noisy and clean input variables, thus shedding light on complex behaviors and fostering confidence in the outcomes. In this paper, we present Forte, a visual analytics-based application to explore deep probabilistic net load forecasting models across various input variables and understand the error rates for different scenarios. With carefully designed visual interventions, this web-based interface empowers scientists to derive insights about model performance by simulating diverse scenarios, facilitating an informed decision-making process. We discuss observations made using Forte and demonstrate the effectiveness of visualization techniques to provide valuable insights into the correlation between weather inputs and net load forecasts, ultimately advancing grid capabilities by improving trust in forecasting models.
TRIVEA: Transparent Ranking Interpretation using Visual Explanation of Black-Box Algorithmic Rankers
Aug 28, 2023


Abstract:Ranking schemes drive many real-world decisions, like, where to study, whom to hire, what to buy, etc. Many of these decisions often come with high consequences. For example, a university can be deemed less prestigious if not featured in a top-k list, and consumers might not even explore products that do not get recommended to buyers. At the heart of most of these decisions are opaque ranking schemes, which dictate the ordering of data entities, but their internal logic is inaccessible or proprietary. Drawing inferences about the ranking differences is like a guessing game to the stakeholders, like, the rankees (i.e., the entities who are ranked, like product companies) and the decision-makers (i.e., who use the rankings, like buyers). In this paper, we aim to enable transparency in ranking interpretation by using algorithmic rankers that learn from available data and by enabling human reasoning about the learned ranking differences using explainable AI (XAI) methods. To realize this aim, we leverage the exploration-explanation paradigm of human-data interaction to let human stakeholders explore subsets and groupings of complex multi-attribute ranking data using visual explanations of model fit and attribute influence on rankings. We realize this explanation paradigm for transparent ranking interpretation in TRIVEA, a visual analytic system that is fueled by: i) visualizations of model fit derived from algorithmic rankers that learn the associations between attributes and rankings from available data and ii) visual explanations derived from XAI methods that help abstract important patterns, like, the relative influence of attributes in different ranking ranges. Using TRIVEA, end users not trained in data science have the agency to transparently reason about the global and local behavior of the rankings without the need to open black-box ranking models and develop confidence in the resulting attribute-based inferences. We demonstrate the efficacy of TRIVEA using multiple usage scenarios and subjective feedback from researchers with diverse domain expertise. Keywords: Visual Analytics, Learning-to-Rank, Explainable ML, Ranking
A Workflow for Visual Diagnostics of Binary Classifiers using Instance-Level Explanations
Oct 01, 2017
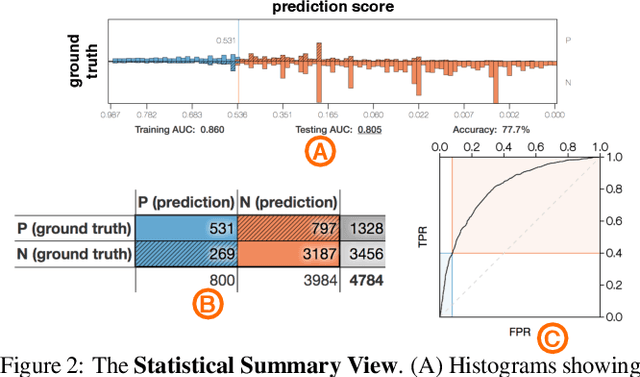
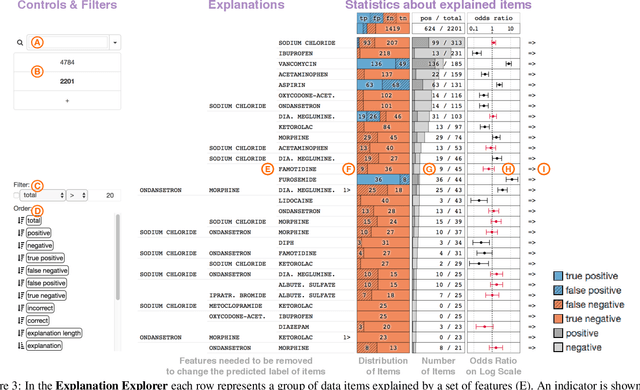
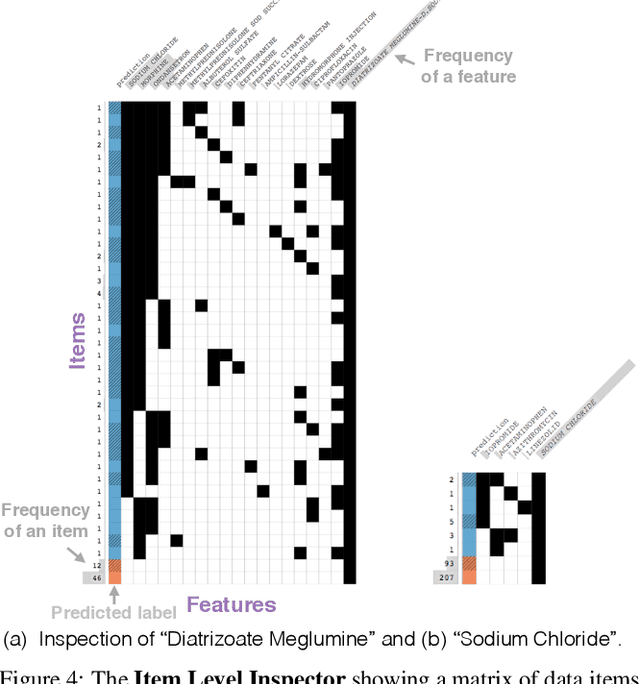
Abstract:Human-in-the-loop data analysis applications necessitate greater transparency in machine learning models for experts to understand and trust their decisions. To this end, we propose a visual analytics workflow to help data scientists and domain experts explore, diagnose, and understand the decisions made by a binary classifier. The approach leverages "instance-level explanations", measures of local feature relevance that explain single instances, and uses them to build a set of visual representations that guide the users in their investigation. The workflow is based on three main visual representations and steps: one based on aggregate statistics to see how data distributes across correct / incorrect decisions; one based on explanations to understand which features are used to make these decisions; and one based on raw data, to derive insights on potential root causes for the observed patterns. The workflow is derived from a long-term collaboration with a group of machine learning and healthcare professionals who used our method to make sense of machine learning models they developed. The case study from this collaboration demonstrates that the proposed workflow helps experts derive useful knowledge about the model and the phenomena it describes, thus experts can generate useful hypotheses on how a model can be improved.
 Add to Chrome
 Add to Firefox
 Add to Edge