Kwan-Liu Ma
SigTime: Learning and Visually Explaining Time Series Signatures
Dec 12, 2025Abstract:Understanding and distinguishing temporal patterns in time series data is essential for scientific discovery and decision-making. For example, in biomedical research, uncovering meaningful patterns in physiological signals can improve diagnosis, risk assessment, and patient outcomes. However, existing methods for time series pattern discovery face major challenges, including high computational complexity, limited interpretability, and difficulty in capturing meaningful temporal structures. To address these gaps, we introduce a novel learning framework that jointly trains two Transformer models using complementary time series representations: shapelet-based representations to capture localized temporal structures and traditional feature engineering to encode statistical properties. The learned shapelets serve as interpretable signatures that differentiate time series across classification labels. Additionally, we develop a visual analytics system -- SigTIme -- with coordinated views to facilitate exploration of time series signatures from multiple perspectives, aiding in useful insights generation. We quantitatively evaluate our learning framework on eight publicly available datasets and one proprietary clinical dataset. Additionally, we demonstrate the effectiveness of our system through two usage scenarios along with the domain experts: one involving public ECG data and the other focused on preterm labor analysis.
Interpreting Structured Perturbations in Image Protection Methods for Diffusion Models
Dec 09, 2025Abstract:Recent image protection mechanisms such as Glaze and Nightshade introduce imperceptible, adversarially designed perturbations intended to disrupt downstream text-to-image generative models. While their empirical effectiveness is known, the internal structure, detectability, and representational behavior of these perturbations remain poorly understood. This study provides a systematic, explainable AI analysis using a unified framework that integrates white-box feature-space inspection and black-box signal-level probing. Through latent-space clustering, feature-channel activation analysis, occlusion-based spatial sensitivity mapping, and frequency-domain characterization, we show that protection mechanisms operate as structured, low-entropy perturbations tightly coupled to underlying image content across representational, spatial, and spectral domains. Protected images preserve content-driven feature organization with protection-specific substructure rather than inducing global representational drift. Detectability is governed by interacting effects of perturbation entropy, spatial deployment, and frequency alignment, with sequential protection amplifying detectable structure rather than suppressing it. Frequency-domain analysis shows that Glaze and Nightshade redistribute energy along dominant image-aligned frequency axes rather than introducing diffuse noise. These findings indicate that contemporary image protection operates through structured feature-level deformation rather than semantic dislocation, explaining why protection signals remain visually subtle yet consistently detectable. This work advances the interpretability of adversarial image protection and informs the design of future defenses and detection strategies for generative AI systems.
HyperFLINT: Hypernetwork-based Flow Estimation and Temporal Interpolation for Scientific Ensemble Visualization
Dec 05, 2024


Abstract:We present HyperFLINT (Hypernetwork-based FLow estimation and temporal INTerpolation), a novel deep learning-based approach for estimating flow fields, temporally interpolating scalar fields, and facilitating parameter space exploration in spatio-temporal scientific ensemble data. This work addresses the critical need to explicitly incorporate ensemble parameters into the learning process, as traditional methods often neglect these, limiting their ability to adapt to diverse simulation settings and provide meaningful insights into the data dynamics. HyperFLINT introduces a hypernetwork to account for simulation parameters, enabling it to generate accurate interpolations and flow fields for each timestep by dynamically adapting to varying conditions, thereby outperforming existing parameter-agnostic approaches. The architecture features modular neural blocks with convolutional and deconvolutional layers, supported by a hypernetwork that generates weights for the main network, allowing the model to better capture intricate simulation dynamics. A series of experiments demonstrates HyperFLINT's significantly improved performance in flow field estimation and temporal interpolation, as well as its potential in enabling parameter space exploration, offering valuable insights into complex scientific ensembles.
SLIM: Spuriousness Mitigation with Minimal Human Annotations
Jul 08, 2024
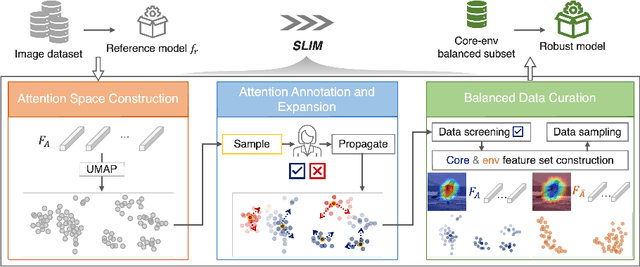
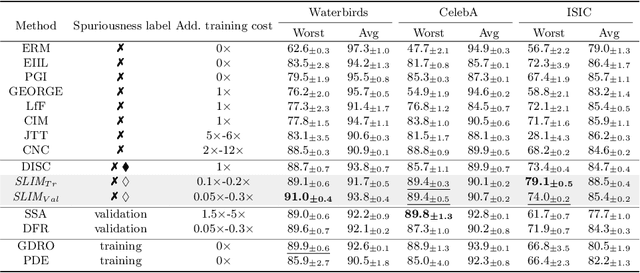

Abstract:Recent studies highlight that deep learning models often learn spurious features mistakenly linked to labels, compromising their reliability in real-world scenarios where such correlations do not hold. Despite the increasing research effort, existing solutions often face two main challenges: they either demand substantial annotations of spurious attributes, or they yield less competitive outcomes with expensive training when additional annotations are absent. In this paper, we introduce SLIM, a cost-effective and performance-targeted approach to reducing spurious correlations in deep learning. Our method leverages a human-in-the-loop protocol featuring a novel attention labeling mechanism with a constructed attention representation space. SLIM significantly reduces the need for exhaustive additional labeling, requiring human input for fewer than 3% of instances. By prioritizing data quality over complicated training strategies, SLIM curates a smaller yet more feature-balanced data subset, fostering the development of spuriousness-robust models. Experimental validations across key benchmarks demonstrate that SLIM competes with or exceeds the performance of leading methods while significantly reducing costs. The SLIM framework thus presents a promising path for developing reliable models more efficiently. Our code is available in https://github.com/xiweix/SLIM.git/.
GNNAnatomy: Systematic Generation and Evaluation of Multi-Level Explanations for Graph Neural Networks
Jun 06, 2024


Abstract:Graph Neural Networks (GNNs) have proven highly effective in various machine learning (ML) tasks involving graphs, such as node/graph classification and link prediction. However, explaining the decisions made by GNNs poses challenges because of the aggregated relational information based on graph structure, leading to complex data transformations. Existing methods for explaining GNNs often face limitations in systematically exploring diverse substructures and evaluating results in the absence of ground truths. To address this gap, we introduce GNNAnatomy, a model- and dataset-agnostic visual analytics system designed to facilitate the generation and evaluation of multi-level explanations for GNNs. In GNNAnatomy, we employ graphlets to elucidate GNN behavior in graph-level classification tasks. By analyzing the associations between GNN classifications and graphlet frequencies, we formulate hypothesized factual and counterfactual explanations. To validate a hypothesized graphlet explanation, we introduce two metrics: (1) the correlation between its frequency and the classification confidence, and (2) the change in classification confidence after removing this substructure from the original graph. To demonstrate the effectiveness of GNNAnatomy, we conduct case studies on both real-world and synthetic graph datasets from various domains. Additionally, we qualitatively compare GNNAnatomy with a state-of-the-art GNN explainer, demonstrating the utility and versatility of our design.
A Reliable Framework for Human-in-the-Loop Anomaly Detection in Time Series
May 07, 2024


Abstract:Time series anomaly detection is a critical machine learning task for numerous applications, such as finance, healthcare, and industrial systems. However, even high-performed models may exhibit potential issues such as biases, leading to unreliable outcomes and misplaced confidence. While model explanation techniques, particularly visual explanations, offer valuable insights to detect such issues by elucidating model attributions of their decision, many limitations still exist -- They are primarily instance-based and not scalable across dataset, and they provide one-directional information from the model to the human side, lacking a mechanism for users to address detected issues. To fulfill these gaps, we introduce HILAD, a novel framework designed to foster a dynamic and bidirectional collaboration between humans and AI for enhancing anomaly detection models in time series. Through our visual interface, HILAD empowers domain experts to detect, interpret, and correct unexpected model behaviors at scale. Our evaluation with two time series datasets and user studies demonstrates the effectiveness of HILAD in fostering a deeper human understanding, immediate corrective actions, and the reliability enhancement of models.
AttributionScanner: A Visual Analytics System for Metadata-Free Data-Slicing Based Model Validation
Jan 12, 2024Abstract:Data slice-finding is an emerging technique for evaluating machine learning models. It works by identifying subgroups within a specified dataset that exhibit poor performance, often defined by distinct feature sets or meta-information. However, in the context of unstructured image data, data slice-finding poses two notable challenges: it requires additional metadata -- a laborious and costly requirement, and also demands non-trivial efforts for interpreting the root causes of the underperformance within data slices. To address these challenges, we introduce AttributionScanner, an innovative human-in-the-loop Visual Analytics (VA) system, designed for data-slicing-based machine learning (ML) model validation. Our approach excels in identifying interpretable data slices, employing explainable features extracted through the lens of Explainable AI (XAI) techniques, and removing the necessity for additional metadata of textual annotations or cross-model embeddings. AttributionScanner demonstrates proficiency in pinpointing critical model issues, including spurious correlations and mislabeled data. Our novel VA interface visually summarizes data slices, enabling users to gather insights into model behavior patterns effortlessly. Furthermore, our framework closes the ML Development Cycle by empowering domain experts to address model issues by using a cutting-edge neural network regularization technique. The efficacy of AttributionScanner is underscored through two prototype use cases, elucidating its substantial effectiveness in model validation for vision-centric tasks. Our approach paves the way for ML researchers and practitioners to drive interpretable model validation in a data-efficient way, ultimately leading to more reliable and accurate models.
A Visual Analytics Design for Connecting Healthcare Team Communication to Patient Outcomes
Jan 08, 2024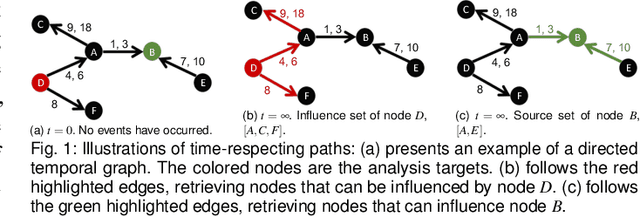

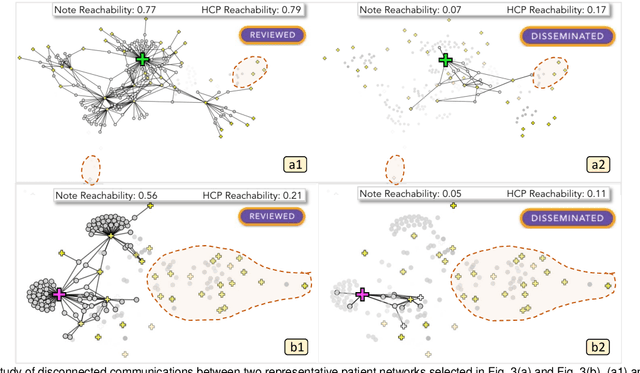
Abstract:Communication among healthcare professionals (HCPs) is crucial for the quality of patient treatment. Surrounding each patient's treatment, communication among HCPs can be examined as temporal networks, constructed from Electronic Health Record (EHR) access logs. This paper introduces a visual analytics system designed to study the effectiveness and efficiency of temporal communication networks mediated by the EHR system. We present a method that associates network measures with patient survival outcomes and devises effectiveness metrics based on these associations. To analyze communication efficiency, we extract the latencies and frequencies of EHR accesses. Our visual analytics system is designed to assist in inspecting and understanding the composed communication effectiveness metrics and to enable the exploration of communication efficiency by encoding latencies and frequencies in an information flow diagram. We demonstrate and evaluate our system through multiple case studies and an expert review.
Visual Analytics for Efficient Image Exploration and User-Guided Image Captioning
Nov 02, 2023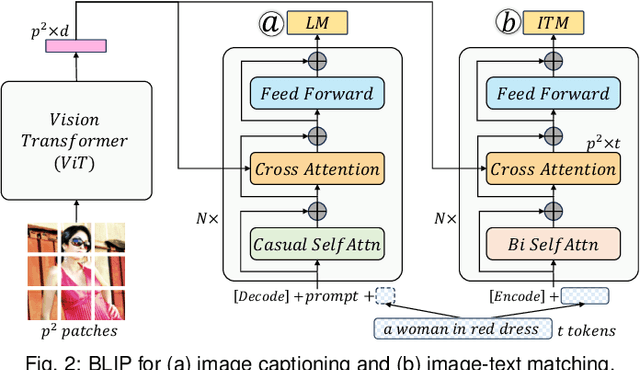


Abstract:Recent advancements in pre-trained large-scale language-image models have ushered in a new era of visual comprehension, offering a significant leap forward. These breakthroughs have proven particularly instrumental in addressing long-standing challenges that were previously daunting. Leveraging these innovative techniques, this paper tackles two well-known issues within the realm of visual analytics: (1) the efficient exploration of large-scale image datasets and identification of potential data biases within them; (2) the evaluation of image captions and steering of their generation process. On the one hand, by visually examining the captions automatically generated from language-image models for an image dataset, we gain deeper insights into the semantic underpinnings of the visual contents, unearthing data biases that may be entrenched within the dataset. On the other hand, by depicting the association between visual contents and textual captions, we expose the weaknesses of pre-trained language-image models in their captioning capability and propose an interactive interface to steer caption generation. The two parts have been coalesced into a coordinated visual analytics system, fostering mutual enrichment of visual and textual elements. We validate the effectiveness of the system with domain practitioners through concrete case studies with large-scale image datasets.
Classes are not Clusters: Improving Label-based Evaluation of Dimensionality Reduction
Aug 11, 2023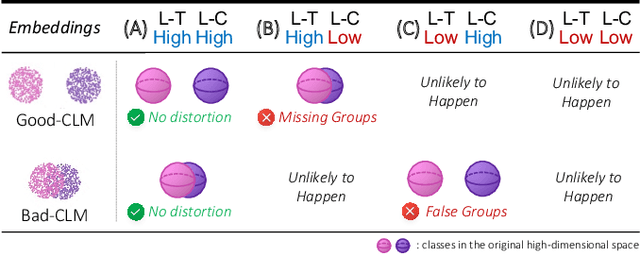
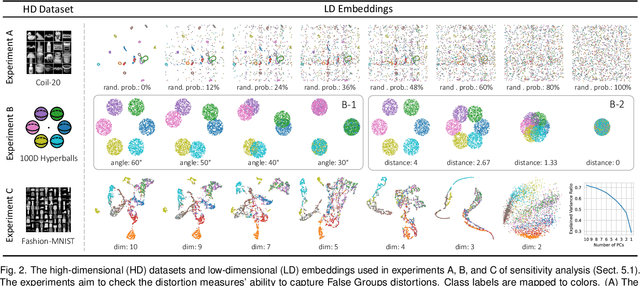
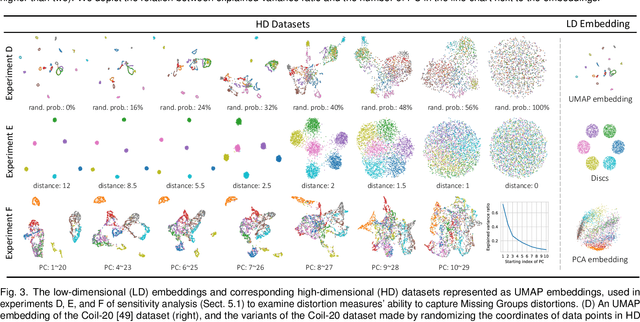
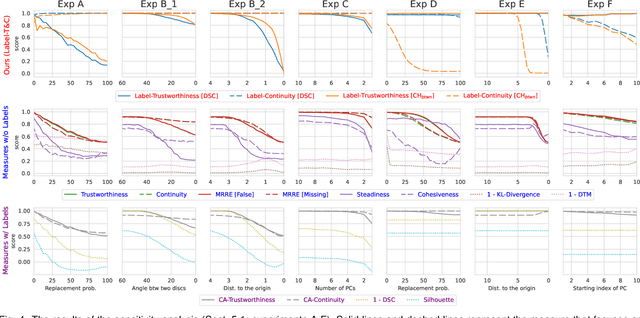
Abstract:A common way to evaluate the reliability of dimensionality reduction (DR) embeddings is to quantify how well labeled classes form compact, mutually separated clusters in the embeddings. This approach is based on the assumption that the classes stay as clear clusters in the original high-dimensional space. However, in reality, this assumption can be violated; a single class can be fragmented into multiple separated clusters, and multiple classes can be merged into a single cluster. We thus cannot always assure the credibility of the evaluation using class labels. In this paper, we introduce two novel quality measures -- Label-Trustworthiness and Label-Continuity (Label-T&C) -- advancing the process of DR evaluation based on class labels. Instead of assuming that classes are well-clustered in the original space, Label-T&C work by (1) estimating the extent to which classes form clusters in the original and embedded spaces and (2) evaluating the difference between the two. A quantitative evaluation showed that Label-T&C outperform widely used DR evaluation measures (e.g., Trustworthiness and Continuity, Kullback-Leibler divergence) in terms of the accuracy in assessing how well DR embeddings preserve the cluster structure, and are also scalable. Moreover, we present case studies demonstrating that Label-T&C can be successfully used for revealing the intrinsic characteristics of DR techniques and their hyperparameters.
 Add to Chrome
 Add to Firefox
 Add to Edge