Junpeng Wang
Towards Efficient Large Scale Spatial-Temporal Time Series Forecasting via Improved Inverted Transformers
Mar 13, 2025Abstract:Time series forecasting at scale presents significant challenges for modern prediction systems, particularly when dealing with large sets of synchronized series, such as in a global payment network. In such systems, three key challenges must be overcome for accurate and scalable predictions: 1) emergence of new entities, 2) disappearance of existing entities, and 3) the large number of entities present in the data. The recently proposed Inverted Transformer (iTransformer) architecture has shown promising results by effectively handling variable entities. However, its practical application in large-scale settings is limited by quadratic time and space complexity ($O(N^2)$) with respect to the number of entities $N$. In this paper, we introduce EiFormer, an improved inverted transformer architecture that maintains the adaptive capabilities of iTransformer while reducing computational complexity to linear scale ($O(N)$). Our key innovation lies in restructuring the attention mechanism to eliminate redundant computations without sacrificing model expressiveness. Additionally, we incorporate a random projection mechanism that not only enhances efficiency but also improves prediction accuracy through better feature representation. Extensive experiments on the public LargeST benchmark dataset and a proprietary large-scale time series dataset demonstrate that EiFormer significantly outperforms existing methods in both computational efficiency and forecasting accuracy. Our approach enables practical deployment of transformer-based forecasting in industrial applications where handling time series at scale is essential.
Visual Attention Exploration in Vision-Based Mamba Models
Feb 28, 2025Abstract:State space models (SSMs) have emerged as an efficient alternative to transformer-based models, offering linear complexity that scales better than transformers. One of the latest advances in SSMs, Mamba, introduces a selective scan mechanism that assigns trainable weights to input tokens, effectively mimicking the attention mechanism. Mamba has also been successfully extended to the vision domain by decomposing 2D images into smaller patches and arranging them as 1D sequences. However, it remains unclear how these patches interact with (or attend to) each other in relation to their original 2D spatial location. Additionally, the order used to arrange the patches into a sequence also significantly impacts their attention distribution. To better understand the attention between patches and explore the attention patterns, we introduce a visual analytics tool specifically designed for vision-based Mamba models. This tool enables a deeper understanding of how attention is distributed across patches in different Mamba blocks and how it evolves throughout a Mamba model. Using the tool, we also investigate the impact of different patch-ordering strategies on the learned attention, offering further insights into the model's behavior.
A Compact Model for Large-Scale Time Series Forecasting
Feb 28, 2025Abstract:Spatio-temporal data, which commonly arise in real-world applications such as traffic monitoring, financial transactions, and ride-share demands, represent a special category of multivariate time series. They exhibit two distinct characteristics: high dimensionality and commensurability across spatial locations. These attributes call for computationally efficient modeling approaches and facilitate the use of univariate forecasting models in a channel-independent fashion. SparseTSF, a recently introduced competitive univariate forecasting model, harnesses periodicity to achieve compactness by concentrating on cross-period dynamics, thereby extending the Pareto frontier with respect to model size and predictive performance. Nonetheless, it underperforms on spatio-temporal data due to an inadequate capture of intra-period temporal dependencies. To address this shortcoming, we propose UltraSTF, which integrates a cross-period forecasting module with an ultra-compact shape bank component. Our model effectively detects recurring patterns in time series through the attention mechanism of the shape bank component, thereby strengthening its ability to learn intra-period dynamics. UltraSTF achieves state-of-the-art performance on the LargeST benchmark while employing fewer than 0.2% of the parameters required by the second-best approaches, thus further extending the Pareto frontier of existing methods.
Matrix Profile for Anomaly Detection on Multidimensional Time Series
Sep 14, 2024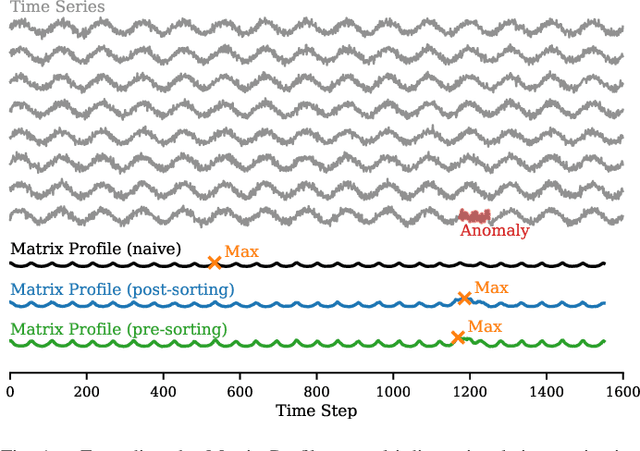
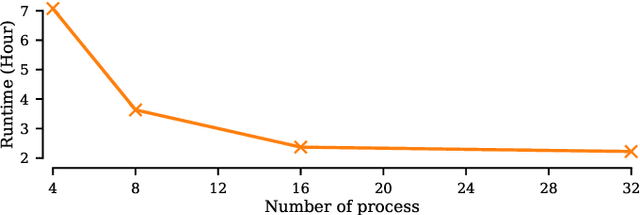
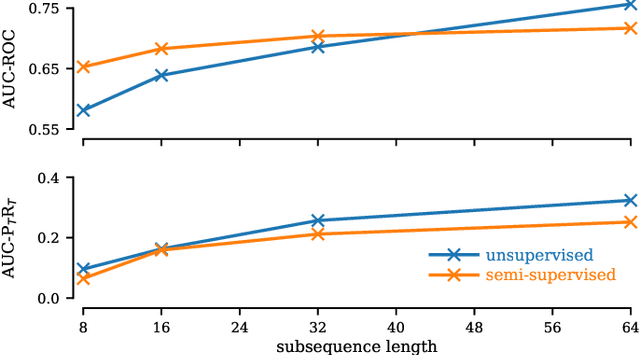
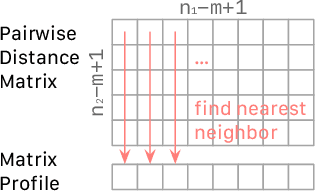
Abstract:The Matrix Profile (MP), a versatile tool for time series data mining, has been shown effective in time series anomaly detection (TSAD). This paper delves into the problem of anomaly detection in multidimensional time series, a common occurrence in real-world applications. For instance, in a manufacturing factory, multiple sensors installed across the site collect time-varying data for analysis. The Matrix Profile, named for its role in profiling the matrix storing pairwise distance between subsequences of univariate time series, becomes complex in multidimensional scenarios. If the input univariate time series has n subsequences, the pairwise distance matrix is a n x n matrix. In a multidimensional time series with d dimensions, the pairwise distance information must be stored in a n x n x d tensor. In this paper, we first analyze different strategies for condensing this tensor into a profile vector. We then investigate the potential of extending the MP to efficiently find k-nearest neighbors for anomaly detection. Finally, we benchmark the multidimensional MP against 19 baseline methods on 119 multidimensional TSAD datasets. The experiments covers three learning setups: unsupervised, supervised, and semi-supervised. MP is the only method that consistently delivers high performance across all setups.
Preserving Individuality while Following the Crowd: Understanding the Role of User Taste and Crowd Wisdom in Online Product Rating Prediction
Sep 06, 2024


Abstract:Numerous algorithms have been developed for online product rating prediction, but the specific influence of user and product information in determining the final prediction score remains largely unexplored. Existing research often relies on narrowly defined data settings, which overlooks real-world challenges such as the cold-start problem, cross-category information utilization, and scalability and deployment issues. To delve deeper into these aspects, and particularly to uncover the roles of individual user taste and collective wisdom, we propose a unique and practical approach that emphasizes historical ratings at both the user and product levels, encapsulated using a continuously updated dynamic tree representation. This representation effectively captures the temporal dynamics of users and products, leverages user information across product categories, and provides a natural solution to the cold-start problem. Furthermore, we have developed an efficient data processing strategy that makes this approach highly scalable and easily deployable. Comprehensive experiments in real industry settings demonstrate the effectiveness of our approach. Notably, our findings reveal that individual taste dominates over collective wisdom in online product rating prediction, a perspective that contrasts with the commonly observed wisdom of the crowd phenomenon in other domains. This dominance of individual user taste is consistent across various model types, including the boosting tree model, recurrent neural network (RNN), and transformer-based architectures. This observation holds true across the overall population, within individual product categories, and in cold-start scenarios. Our findings underscore the significance of individual user tastes in the context of online product rating prediction and the robustness of our approach across different model architectures.
Adversarial Attacks on Machine Learning-Aided Visualizations
Sep 04, 2024Abstract:Research in ML4VIS investigates how to use machine learning (ML) techniques to generate visualizations, and the field is rapidly growing with high societal impact. However, as with any computational pipeline that employs ML processes, ML4VIS approaches are susceptible to a range of ML-specific adversarial attacks. These attacks can manipulate visualization generations, causing analysts to be tricked and their judgments to be impaired. Due to a lack of synthesis from both visualization and ML perspectives, this security aspect is largely overlooked by the current ML4VIS literature. To bridge this gap, we investigate the potential vulnerabilities of ML-aided visualizations from adversarial attacks using a holistic lens of both visualization and ML perspectives. We first identify the attack surface (i.e., attack entry points) that is unique in ML-aided visualizations. We then exemplify five different adversarial attacks. These examples highlight the range of possible attacks when considering the attack surface and multiple different adversary capabilities. Our results show that adversaries can induce various attacks, such as creating arbitrary and deceptive visualizations, by systematically identifying input attributes that are influential in ML inferences. Based on our observations of the attack surface characteristics and the attack examples, we underline the importance of comprehensive studies of security issues and defense mechanisms as a call of urgency for the ML4VIS community.
A Systematic Evaluation of Generated Time Series and Their Effects in Self-Supervised Pretraining
Aug 15, 2024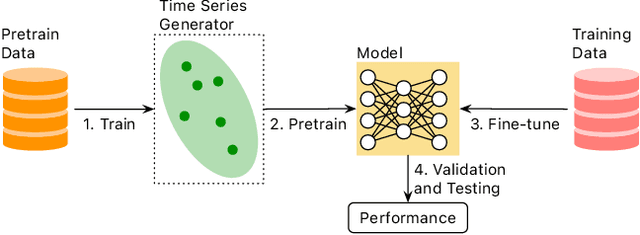


Abstract:Self-supervised Pretrained Models (PTMs) have demonstrated remarkable performance in computer vision and natural language processing tasks. These successes have prompted researchers to design PTMs for time series data. In our experiments, most self-supervised time series PTMs were surpassed by simple supervised models. We hypothesize this undesired phenomenon may be caused by data scarcity. In response, we test six time series generation methods, use the generated data in pretraining in lieu of the real data, and examine the effects on classification performance. Our results indicate that replacing a real-data pretraining set with a greater volume of only generated samples produces noticeable improvement.
ParamsDrag: Interactive Parameter Space Exploration via Image-Space Dragging
Jul 19, 2024Abstract:Numerical simulation serves as a cornerstone in scientific modeling, yet the process of fine-tuning simulation parameters poses significant challenges. Conventionally, parameter adjustment relies on extensive numerical simulations, data analysis, and expert insights, resulting in substantial computational costs and low efficiency. The emergence of deep learning in recent years has provided promising avenues for more efficient exploration of parameter spaces. However, existing approaches often lack intuitive methods for precise parameter adjustment and optimization. To tackle these challenges, we introduce ParamsDrag, a model that facilitates parameter space exploration through direct interaction with visualizations. Inspired by DragGAN, our ParamsDrag model operates in three steps. First, the generative component of ParamsDrag generates visualizations based on the input simulation parameters. Second, by directly dragging structure-related features in the visualizations, users can intuitively understand the controlling effect of different parameters. Third, with the understanding from the earlier step, users can steer ParamsDrag to produce dynamic visual outcomes. Through experiments conducted on real-world simulations and comparisons with state-of-the-art deep learning-based approaches, we demonstrate the efficacy of our solution.
Random Projection Layers for Multidimensional Time Series Forecasting
Feb 29, 2024


Abstract:All-Multi-Layer Perceptron (all-MLP) mixer models have been shown to be effective for time series forecasting problems. However, when such a model is applied to high-dimensional time series (e.g., the time series in a spatial-temporal dataset), its performance is likely to degrade due to overfitting issues. In this paper, we propose an all-MLP time series forecasting architecture, referred to as RPMixer. Our method leverages the ensemble-like behavior of deep neural networks, where each individual block within the network acts like a base learner in an ensemble model, especially when identity mapping residual connections are incorporated. By integrating random projection layers into our model, we increase the diversity among the blocks' outputs, thereby enhancing the overall performance of RPMixer. Extensive experiments conducted on large-scale spatial-temporal forecasting benchmark datasets demonstrate that our proposed method outperforms alternative methods, including both spatial-temporal graph models and general forecasting models.
PUPAE: Intuitive and Actionable Explanations for Time Series Anomalies
Jan 16, 2024


Abstract:In recent years there has been significant progress in time series anomaly detection. However, after detecting an (perhaps tentative) anomaly, can we explain it? Such explanations would be useful to triage anomalies. For example, in an oil refinery, should we respond to an anomaly by dispatching a hydraulic engineer, or an intern to replace the battery on a sensor? There have been some parallel efforts to explain anomalies, however many proposed techniques produce explanations that are indirect, and often seem more complex than the anomaly they seek to explain. Our review of the literature/checklists/user-manuals used by frontline practitioners in various domains reveals an interesting near-universal commonality. Most practitioners discuss, explain and report anomalies in the following format: The anomaly would be like normal data A, if not for the corruption B. The reader will appreciate that is a type of counterfactual explanation. In this work we introduce a domain agnostic counterfactual explanation technique to produce explanations for time series anomalies. As we will show, our method can produce both visual and text-based explanations that are objectively correct, intuitive and in many circumstances, directly actionable.
* 9 Page Manuscript, 1 Page Supplementary (Supplement not published in conference proceedings.)
 Add to Chrome
 Add to Firefox
 Add to Edge