Rafael M. Martins
Adversarial Attacks on Machine Learning-Aided Visualizations
Sep 04, 2024Abstract:Research in ML4VIS investigates how to use machine learning (ML) techniques to generate visualizations, and the field is rapidly growing with high societal impact. However, as with any computational pipeline that employs ML processes, ML4VIS approaches are susceptible to a range of ML-specific adversarial attacks. These attacks can manipulate visualization generations, causing analysts to be tricked and their judgments to be impaired. Due to a lack of synthesis from both visualization and ML perspectives, this security aspect is largely overlooked by the current ML4VIS literature. To bridge this gap, we investigate the potential vulnerabilities of ML-aided visualizations from adversarial attacks using a holistic lens of both visualization and ML perspectives. We first identify the attack surface (i.e., attack entry points) that is unique in ML-aided visualizations. We then exemplify five different adversarial attacks. These examples highlight the range of possible attacks when considering the attack surface and multiple different adversary capabilities. Our results show that adversaries can induce various attacks, such as creating arbitrary and deceptive visualizations, by systematically identifying input attributes that are influential in ML inferences. Based on our observations of the attack surface characteristics and the attack examples, we underline the importance of comprehensive studies of security issues and defense mechanisms as a call of urgency for the ML4VIS community.
DimVis: Interpreting Visual Clusters in Dimensionality Reduction With Explainable Boosting Machine
Feb 10, 2024Abstract:Dimensionality Reduction (DR) techniques such as t-SNE and UMAP are popular for transforming complex datasets into simpler visual representations. However, while effective in uncovering general dataset patterns, these methods may introduce artifacts and suffer from interpretability issues. This paper presents DimVis, a visualization tool that employs supervised Explainable Boosting Machine (EBM) models (trained on user-selected data of interest) as an interpretation assistant for DR projections. Our tool facilitates high-dimensional data analysis by providing an interpretation of feature relevance in visual clusters through interactive exploration of UMAP projections. Specifically, DimVis uses a contrastive EBM model that is trained in real time to differentiate between the data inside and outside a cluster of interest. Taking advantage of the inherent explainable nature of the EBM, we then use this model to interpret the cluster itself via single and pairwise feature comparisons in a ranking based on the EBM model's feature importance. The applicability and effectiveness of DimVis are demonstrated through two use cases involving real-world datasets, and we also discuss the limitations and potential directions for future research.
DeforestVis: Behavior Analysis of Machine Learning Models with Surrogate Decision Stumps
Mar 31, 2023


Abstract:As the complexity of machine learning (ML) models increases and the applications in different (and critical) domains grow, there is a strong demand for more interpretable and trustworthy ML. One straightforward and model-agnostic way to interpret complex ML models is to train surrogate models, such as rule sets and decision trees, that sufficiently approximate the original ones while being simpler and easier-to-explain. Yet, rule sets can become very lengthy, with many if-else statements, and decision tree depth grows rapidly when accurately emulating complex ML models. In such cases, both approaches can fail to meet their core goal, providing users with model interpretability. We tackle this by proposing DeforestVis, a visual analytics tool that offers user-friendly summarization of the behavior of complex ML models by providing surrogate decision stumps (one-level decision trees) generated with the adaptive boosting (AdaBoost) technique. Our solution helps users to explore the complexity vs fidelity trade-off by incrementally generating more stumps, creating attribute-based explanations with weighted stumps to justify decision making, and analyzing the impact of rule overriding on training instance allocation between one or more stumps. An independent test set allows users to monitor the effectiveness of manual rule changes and form hypotheses based on case-by-case investigations. We show the applicability and usefulness of DeforestVis with two use cases and expert interviews with data analysts and model developers.
VisRuler: Visual Analytics for Extracting Decision Rules from Bagged and Boosted Decision Trees
Dec 01, 2021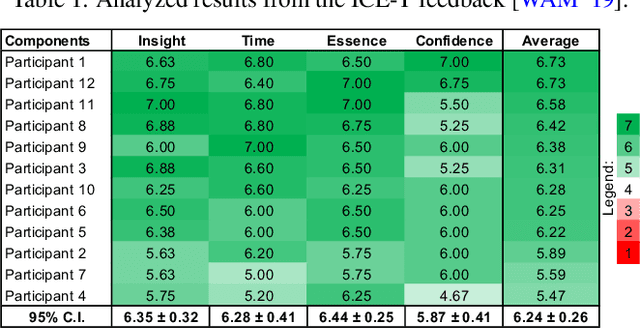
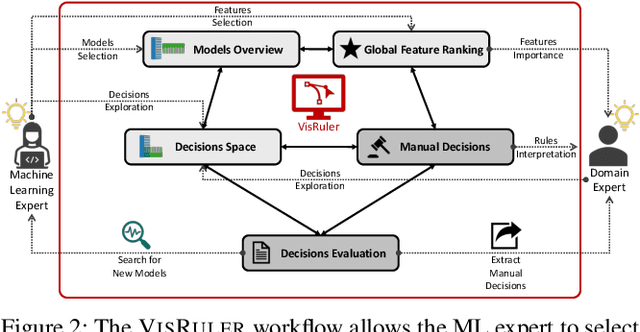
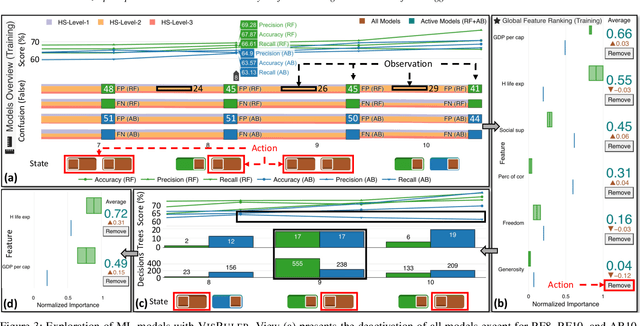
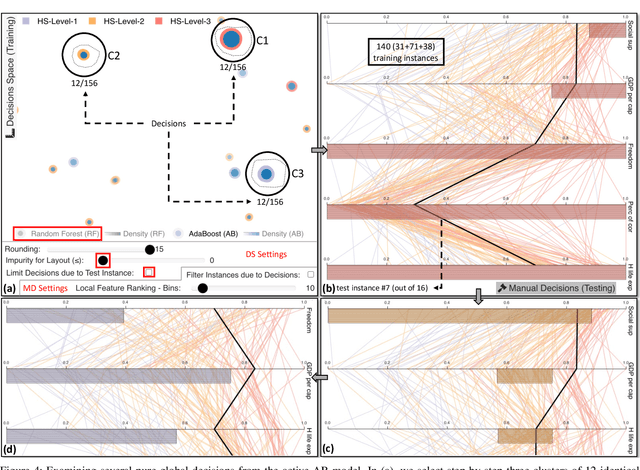
Abstract:Bagging and boosting are two popular ensemble methods in machine learning (ML) that produce many individual decision trees. Due to the inherent ensemble characteristic of these methods, they typically outperform single decision trees or other ML models in predictive performance. However, numerous decision paths are generated for each decision tree, increasing the overall complexity of the model and hindering its use in domains that require trustworthy and explainable decisions, such as finance, social care, and health care. Thus, the interpretability of bagging and boosting algorithms, such as random forests and adaptive boosting, reduces as the number of decisions rises. In this paper, we propose a visual analytics tool that aims to assist users in extracting decisions from such ML models via a thorough visual inspection workflow that includes selecting a set of robust and diverse models (originating from different ensemble learning algorithms), choosing important features according to their global contribution, and deciding which decisions are essential for global explanation (or locally, for specific cases). The outcome is a final decision based on the class agreement of several models and the explored manual decisions exported by users. Finally, we evaluate the applicability and effectiveness of VisRuler via a use case, a usage scenario, and a user study.
HUMAP: Hierarchical Uniform Manifold Approximation and Projection
Jun 14, 2021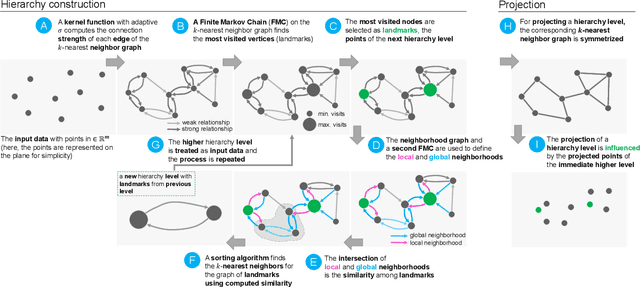
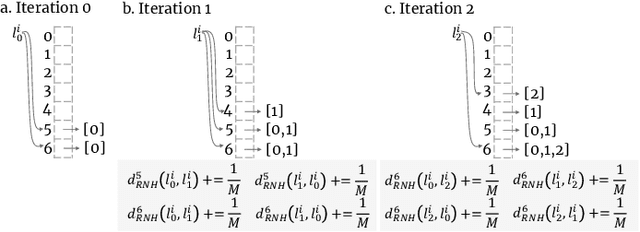
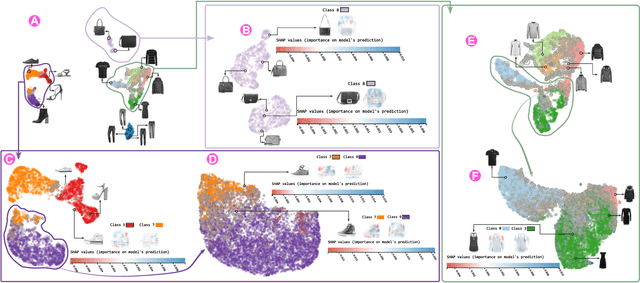
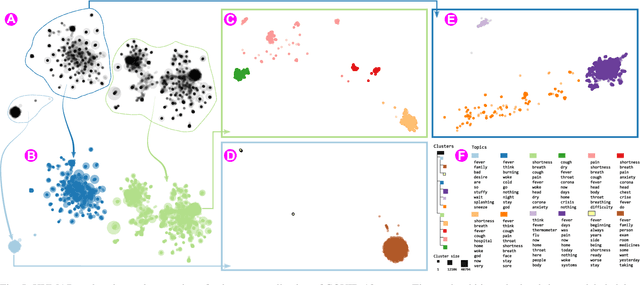
Abstract:Dimensionality reduction (DR) techniques help analysts to understand patterns in high-dimensional spaces. These techniques, often represented by scatter plots, are employed in diverse science domains and facilitate similarity analysis among clusters and data samples. For datasets containing many granularities or when analysis follows the information visualization mantra, hierarchical DR techniques are the most suitable approach since they present major structures beforehand and details on demand. However, current hierarchical DR techniques are not fully capable of addressing literature problems because they do not preserve the projection mental map across hierarchical levels or are not suitable for most data types. This work presents HUMAP, a novel hierarchical dimensionality reduction technique designed to be flexible on preserving local and global structures and preserve the mental map throughout hierarchical exploration. We provide empirical evidence of our technique's superiority compared with current hierarchical approaches and show two case studies to demonstrate its strengths.
FeatureEnVi: Visual Analytics for Feature Engineering Using Stepwise Selection and Semi-Automatic Extraction Approaches
Mar 26, 2021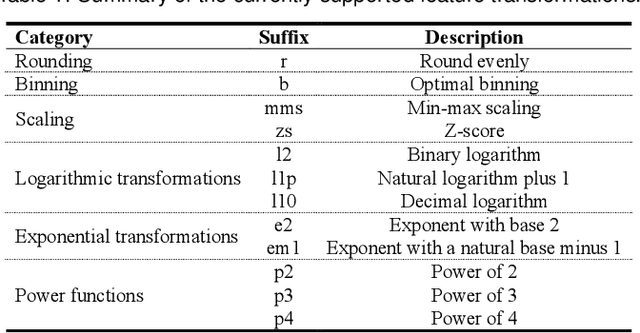
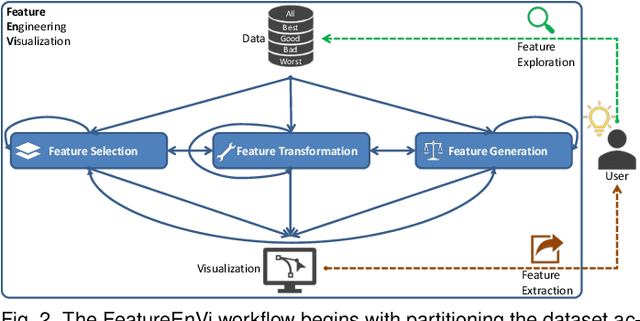
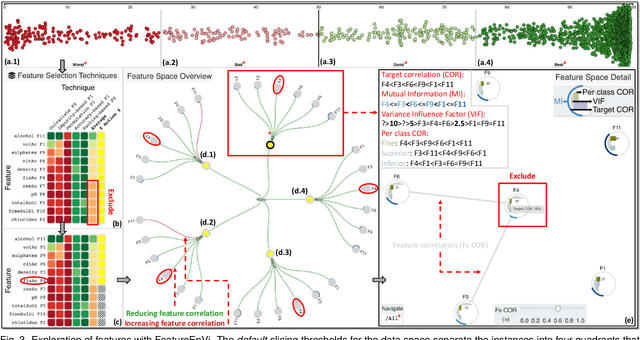
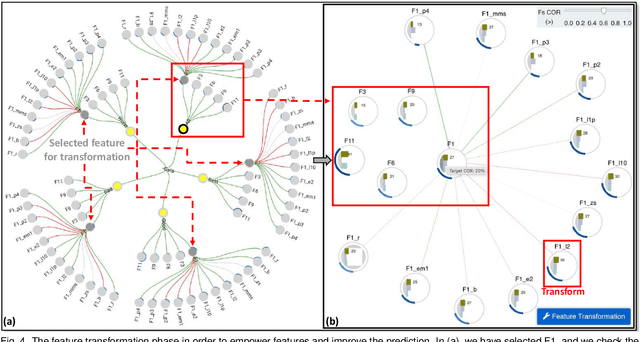
Abstract:The machine learning (ML) life cycle involves a series of iterative steps, from the effective gathering and preparation of the data, including complex feature engineering processes, to the presentation and improvement of results, with various algorithms to choose from in every step. Feature engineering in particular can be very beneficial for ML, leading to numerous improvements such as boosting the predictive results, decreasing computational times, reducing excessive noise, and increasing the transparency behind the decisions taken during the training. Despite that, while several visual analytics tools exist to monitor and control the different stages of the ML life cycle (especially those related to data and algorithms), feature engineering support remains inadequate. In this paper, we present FeatureEnVi, a visual analytics system specifically designed to assist with the feature engineering process. Our proposed system helps users to choose the most important feature, to transform the original features into powerful alternatives, and to experiment with different feature generation combinations. Additionally, data space slicing allows users to explore the impact of features on both local and global scales. FeatureEnVi utilizes multiple automatic feature selection techniques; furthermore, it visually guides users with statistical evidence about the influence of each feature (or subsets of features). The final outcome is the extraction of heavily engineered features, evaluated by multiple validation metrics. The usefulness and applicability of FeatureEnVi are demonstrated with two use cases, using a popular red wine quality data set and publicly available data related to vehicle recognition from their silhouettes. We also report feedback from interviews with ML experts and a visualization researcher who assessed the effectiveness of our system.
VisEvol: Visual Analytics to Support Hyperparameter Search through Evolutionary Optimization
Dec 02, 2020
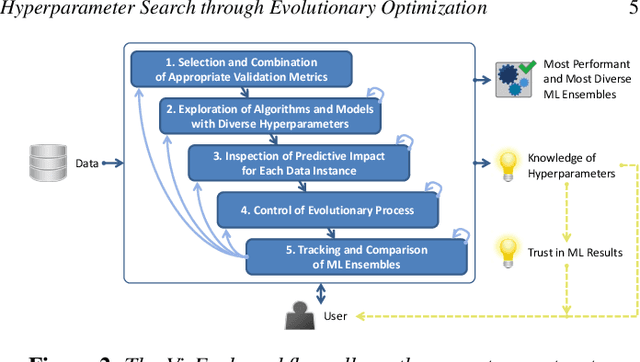


Abstract:During the training phase of machine learning (ML) models, it is usually necessary to configure several hyperparameters. This process is computationally intensive and requires an extensive search to infer the best hyperparameter set for the given problem. The challenge is exacerbated by the fact that most ML models are complex internally, and training involves trial-and-error processes that could remarkably affect the predictive result. Moreover, each hyperparameter of an ML algorithm is potentially intertwined with the others, and changing it might result in unforeseeable impacts on the remaining hyperparameters. Evolutionary optimization is a promising method to try and address those issues. According to this method, performant models are stored, while the remainder are improved through crossover and mutation processes inspired by genetic algorithms. We present VisEvol, a visual analytics tool that supports interactive exploration of hyperparameters and intervention in this evolutionary procedure. In summary, our proposed tool helps the user to generate new models through evolution and eventually explore powerful hyperparameter combinations in diverse regions of the extensive hyperparameter space. The outcome is a voting ensemble (with equal rights) that boosts the final predictive performance. The utility and applicability of VisEvol are demonstrated with two use cases and interviews with ML experts who evaluated the effectiveness of the tool.
StackGenVis: Alignment of Data, Algorithms, and Models for Stacking Ensemble Learning Using Performance Metrics
May 04, 2020

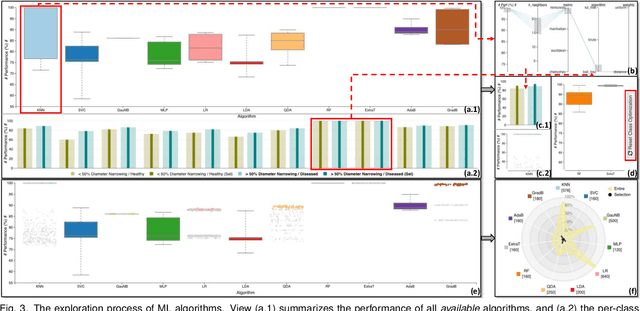

Abstract:In machine learning (ML), ensemble methods such as bagging, boosting, and stacking are widely-established approaches that regularly achieve top-notch predictive performance. Stacking (also called "stacked generalization") is an ensemble method that combines heterogeneous base models, arranged in at least one layer, and then employs another metamodel to summarize the predictions of those models. Although it may be a highly-effective approach for increasing the predictive performance of ML, generating a stack of models from scratch can be a cumbersome trial-and-error process. This challenge stems from the enormous space of available solutions, with different sets of data instances and features that could be used for training, several algorithms to choose from, and instantiations of these algorithms (i.e., models) that perform differently according to diverse metrics. In this work, we present a knowledge generation model, which supports ensemble learning with the use of visualization, and a visual analytics system for stacked generalization. Our system, StackGenVis, assists users in dynamically managing data instances, selecting the most important features for a given data set, and choosing a set of top-performant and diverse algorithms. In consequence, our proposed tool helps users to decide between distinct models and to reduce the complexity of the resulting stack by removing overpromising and underperforming models. The applicability and effectiveness of StackGenVis are demonstrated with two use cases: a real-world healthcare data set and a collection of data related to sentiment/stance detection in texts. Finally, the tool has been evaluated through interviews with three ML experts.
Xtreaming: an incremental multidimensional projection technique and its application to streaming data
Mar 08, 2020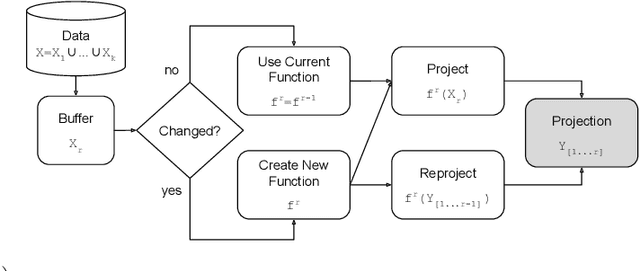

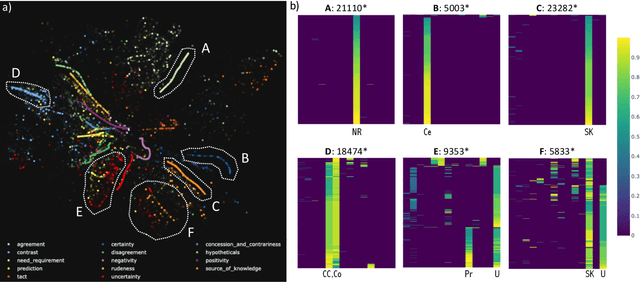
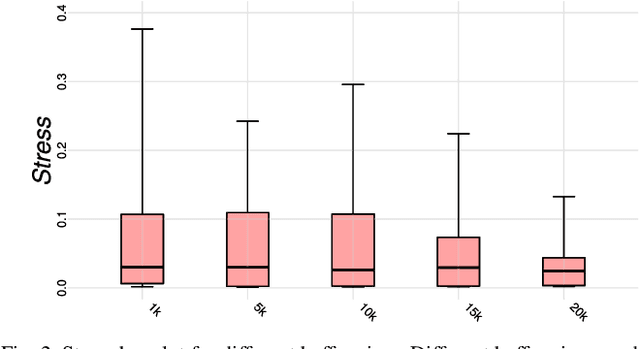
Abstract:Streaming data applications are becoming more common due to the ability of different information sources to continuously capture or produce data, such as sensors and social media. Despite recent advances, most visualization approaches, in particular, multidimensional projection or dimensionality reduction techniques, cannot be directly applied in such scenarios due to the transient nature of streaming data. Currently, only a few methods address this limitation using online or incremental strategies, continuously processing data, and updating the visualization. Despite their relative success, most of them impose the need for storing and accessing the data multiple times, not being appropriate for streaming where data continuously grow. Others do not impose such requirements but are not capable of updating the position of the data already projected, potentially resulting in visual artifacts. In this paper, we present Xtreaming, a novel incremental projection technique that continuously updates the visual representation to reflect new emerging structures or patterns without visiting the multidimensional data more than once. Our tests show that Xtreaming is competitive in terms of global distance preservation if compared to other streaming and incremental techniques, but it is orders of magnitude faster. To the best of our knowledge, it is the first methodology that is capable of evolving a projection to faithfully represent new emerging structures without the need to store all data, providing reliable results for efficiently and effectively projecting streaming data.
 Add to Chrome
 Add to Firefox
 Add to Edge