Wilson E. Marcílio-Jr
HUMAP: Hierarchical Uniform Manifold Approximation and Projection
Jun 14, 2021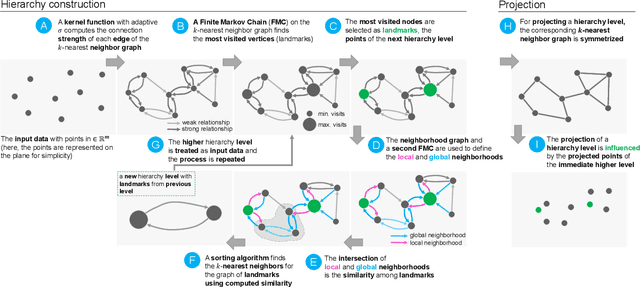
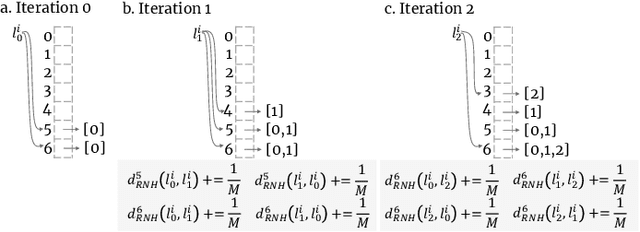
Abstract:Dimensionality reduction (DR) techniques help analysts to understand patterns in high-dimensional spaces. These techniques, often represented by scatter plots, are employed in diverse science domains and facilitate similarity analysis among clusters and data samples. For datasets containing many granularities or when analysis follows the information visualization mantra, hierarchical DR techniques are the most suitable approach since they present major structures beforehand and details on demand. However, current hierarchical DR techniques are not fully capable of addressing literature problems because they do not preserve the projection mental map across hierarchical levels or are not suitable for most data types. This work presents HUMAP, a novel hierarchical dimensionality reduction technique designed to be flexible on preserving local and global structures and preserve the mental map throughout hierarchical exploration. We provide empirical evidence of our technique's superiority compared with current hierarchical approaches and show two case studies to demonstrate its strengths.
Contrastive analysis for scatter plot-based representations of dimensionality reduction
Jan 26, 2021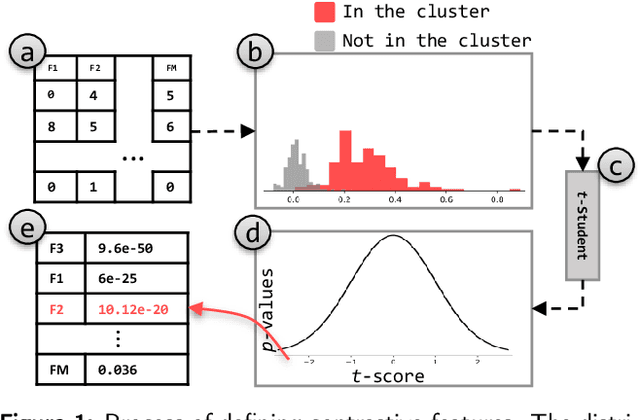
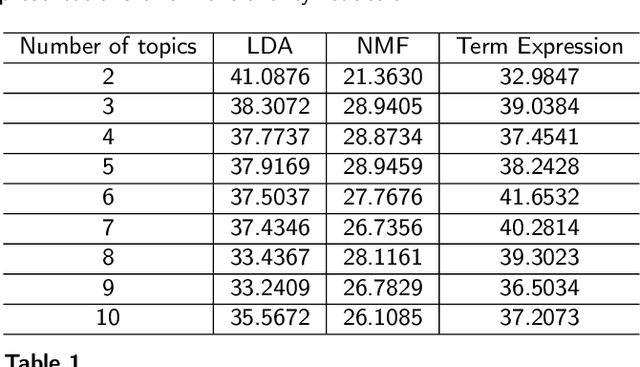
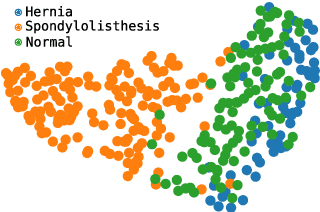
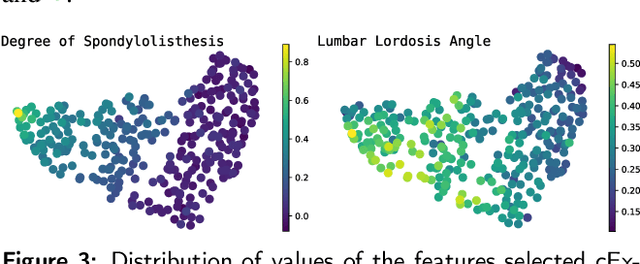
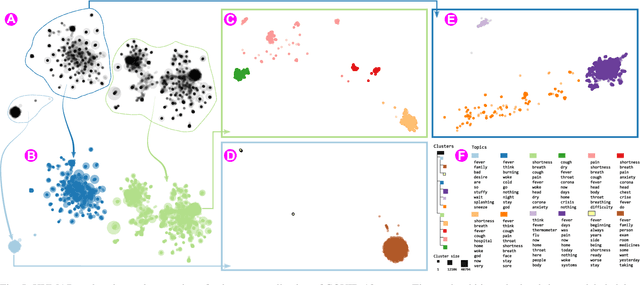
Abstract:Exploring multidimensional datasets is a ubiquitous part of the ones working with data, where interpreting clusters is one of the main tasks. These multidimensional datasets are usually encoded using scatter-plots representations, where spatial proximity encodes similarity among data samples. In the literature, techniques try to understand the scatter plot organization by visualizing the importance of the features for clusters definition with interaction and layout enrichment strategies. However, the approaches used to interpret dimensionality reduction usually do not differentiate clusters well, which hampers analysis where the focus is to understand the differences among clusters. This paper introduces a methodology to visually explore multidimensional datasets and interpret clusters' formation based on the contrastive analysis. We also introduce a bipartite graph to visually interpret and explore the relationship between the statistical variables used to understand how the attributes influenced cluster formation. Our methodology is validated through case studies. We explore a multivariate dataset of patients with vertebral problems and two document collections, one related to news articles and other related to tweets about COVID-19 symptoms. Finally, we also validate our approach through quantitative results to demonstrate how it can be robust enough to support multidimensional analysis.
Model-agnostic interpretation by visualization of feature perturbations
Jan 26, 2021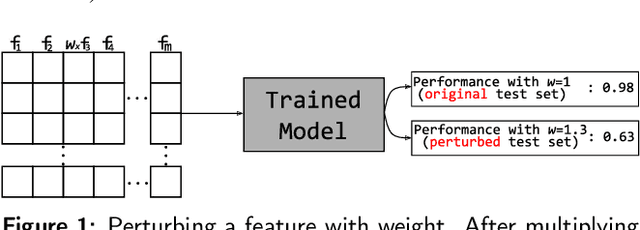
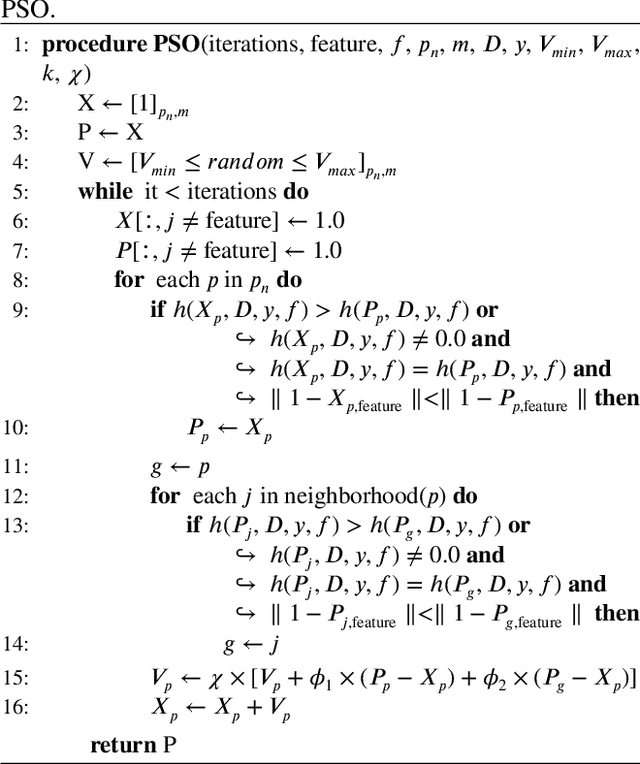


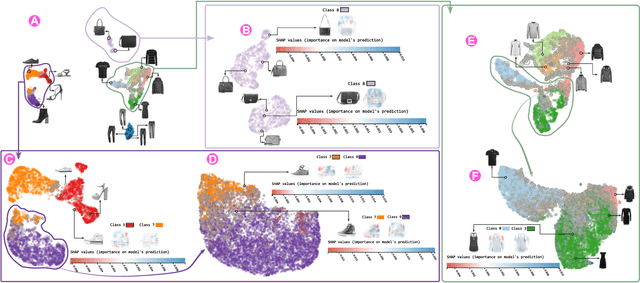
Abstract:Interpretation of machine learning models has become one of the most important topics of research due to the necessity of maintaining control and avoid bias in these algorithms. Since many machine learning algorithms are published every day, there is a need for novel model-agnostic interpretation approaches that could be used to interpret a great variety of algorithms. One particularly useful way to interpret machine learning models is to feed different input data to understand the changes in the prediction. Using such an approach, practitioners can define relations among patterns of data and a model's decision. In this work, we propose a model-agnostic interpretation approach that uses visualization of feature perturbations induced by the particle swarm optimization algorithm. We validate our approach both qualitatively and quantitatively on publicly available datasets, showing the capability to enhance the interpretation of different classifiers while yielding very stable results if compared with the state of the art algorithms.
 Add to Chrome
 Add to Firefox
 Add to Edge