Fernando V. Paulovich
Why Can't I See My Clusters? A Precision-Recall Approach to Dimensionality Reduction Validation
Sep 04, 2025Abstract:Dimensionality Reduction (DR) is widely used for visualizing high-dimensional data, often with the goal of revealing expected cluster structure. However, such a structure may not always appear in the projections. Existing DR quality metrics assess projection reliability (to some extent) or cluster structure quality, but do not explain why expected structures are missing. Visual Analytics solutions can help, but are often time-consuming due to the large hyperparameter space. This paper addresses this problem by leveraging a recent framework that divides the DR process into two phases: a relationship phase, where similarity relationships are modeled, and a mapping phase, where the data is projected accordingly. We introduce two supervised metrics, precision and recall, to evaluate the relationship phase. These metrics quantify how well the modeled relationships align with an expected cluster structure based on some set of labels representing this structure. We illustrate their application using t-SNE and UMAP, and validate the approach through various usage scenarios. Our approach can guide hyperparameter tuning, uncover projection artifacts, and determine if the expected structure is captured in the relationships, making the DR process faster and more reliable.
HardVis: Visual Analytics to Handle Instance Hardness Using Undersampling and Oversampling Techniques
Mar 29, 2022


Abstract:Despite the tremendous advances in machine learning (ML), training with imbalanced data still poses challenges in many real-world applications. Among a series of diverse techniques to solve this problem, sampling algorithms are regarded as an efficient solution. However, the problem is more fundamental, with many works emphasizing the importance of instance hardness. This issue refers to the significance of managing unsafe or potentially noisy instances that are more likely to be misclassified and serve as the root cause of poor classification performance. This paper introduces HardVis, a visual analytics system designed to handle instance hardness mainly in imbalanced classification scenarios. Our proposed system assists users in visually comparing different distributions of data types, selecting types of instances based on local characteristics that will later be affected by the active sampling method, and validating which suggestions from undersampling or oversampling techniques are beneficial for the ML model. Additionally, rather than uniformly undersampling/oversampling a specific class, we allow users to find and sample easy and difficult to classify training instances from all classes. Users can explore subsets of data from different perspectives to decide all those parameters, while HardVis keeps track of their steps and evaluates the model's predictive performance in a test set separately. The end result is a well-balanced data set that boosts the predictive power of the ML model. The efficacy and effectiveness of HardVis are demonstrated with a hypothetical usage scenario and a use case. Finally, we also look at how useful our system is based on feedback we received from ML experts.
Multivariate Data Explanation by Jumping Emerging Patterns Visualization
Jun 21, 2021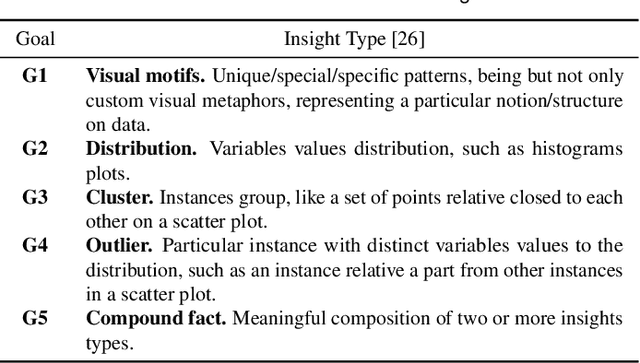

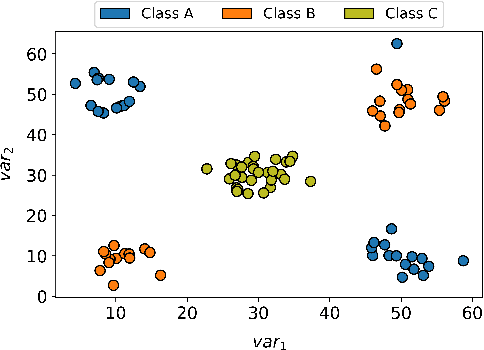
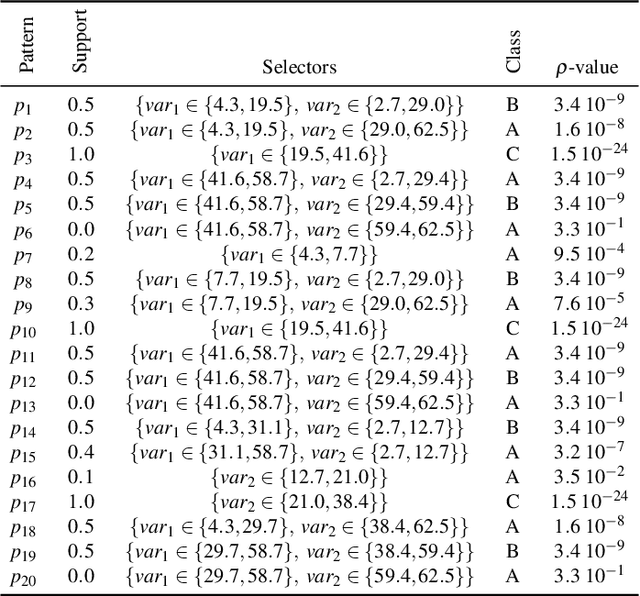
Abstract:Visual Analytics (VA) tools and techniques have shown to be instrumental in supporting users to build better classification models, interpret model decisions and audit results. In a different direction, VA has recently been applied to transform classification models into descriptive mechanisms instead of predictive. The idea is to use such models as surrogates for data patterns, visualizing the model to understand the phenomenon represented by the data. Although very useful and inspiring, the few proposed approaches have opted to use low complex classification models to promote straightforward interpretation, presenting limitations to capture intricate data patterns. In this paper, we present VAX (multiVariate dAta eXplanation), a new VA method to support the identification and visual interpretation of patterns in multivariate data sets. Unlike the existing similar approaches, VAX uses the concept of Jumping Emerging Patterns to identify and aggregate several diversified patterns, producing explanations through logic combinations of data variables. The potential of VAX to interpret complex multivariate datasets is demonstrated through study-cases using two real-world data sets covering different scenarios.
HUMAP: Hierarchical Uniform Manifold Approximation and Projection
Jun 14, 2021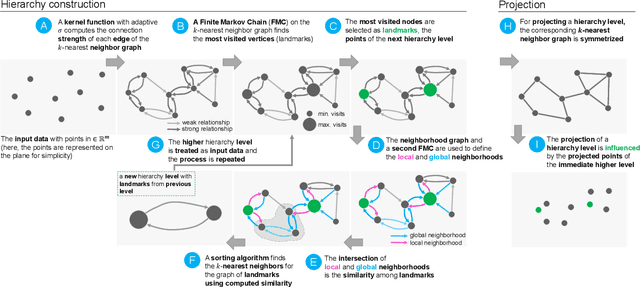
Abstract:Dimensionality reduction (DR) techniques help analysts to understand patterns in high-dimensional spaces. These techniques, often represented by scatter plots, are employed in diverse science domains and facilitate similarity analysis among clusters and data samples. For datasets containing many granularities or when analysis follows the information visualization mantra, hierarchical DR techniques are the most suitable approach since they present major structures beforehand and details on demand. However, current hierarchical DR techniques are not fully capable of addressing literature problems because they do not preserve the projection mental map across hierarchical levels or are not suitable for most data types. This work presents HUMAP, a novel hierarchical dimensionality reduction technique designed to be flexible on preserving local and global structures and preserve the mental map throughout hierarchical exploration. We provide empirical evidence of our technique's superiority compared with current hierarchical approaches and show two case studies to demonstrate its strengths.
Explainable Adversarial Attacks in Deep Neural Networks Using Activation Profiles
Mar 18, 2021


Abstract:As neural networks become the tool of choice to solve an increasing variety of problems in our society, adversarial attacks become critical. The possibility of generating data instances deliberately designed to fool a network's analysis can have disastrous consequences. Recent work has shown that commonly used methods for model training often result in fragile abstract representations that are particularly vulnerable to such attacks. This paper presents a visual framework to investigate neural network models subjected to adversarial examples, revealing how models' perception of the adversarial data differs from regular data instances and their relationships with class perception. Through different use cases, we show how observing these elements can quickly pinpoint exploited areas in a model, allowing further study of vulnerable features in input data and serving as a guide to improving model training and architecture.
Explainable Patterns: Going from Findings to Insights to Support Data Analytics Democratization
Jan 19, 2021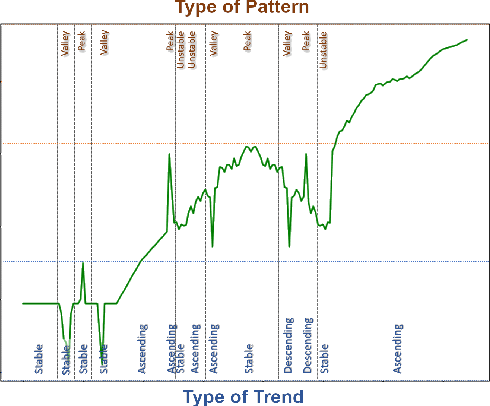
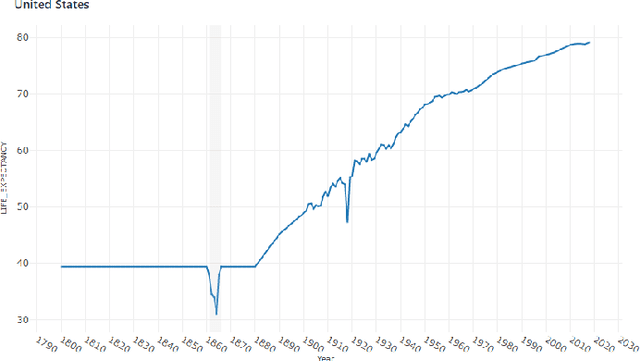
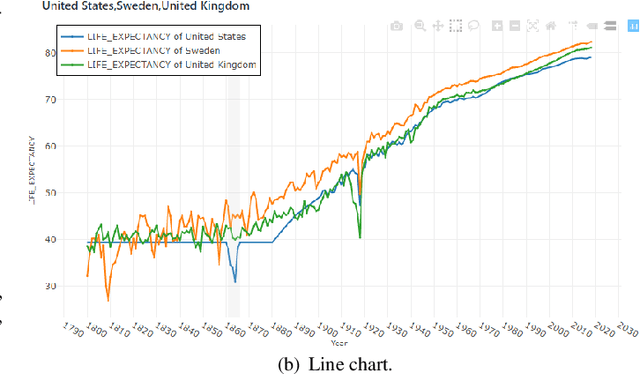
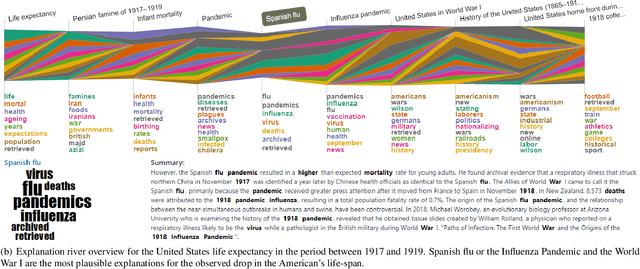
Abstract:In the past decades, massive efforts involving companies, non-profit organizations, governments, and others have been put into supporting the concept of data democratization, promoting initiatives to educate people to confront information with data. Although this represents one of the most critical advances in our free world, access to data without concrete facts to check or the lack of an expert to help on understanding the existing patterns hampers its intrinsic value and lessens its democratization. So the benefits of giving full access to data will only be impactful if we go a step further and support the Data Analytics Democratization, assisting users in transforming findings into insights without the need of domain experts to promote unconstrained access to data interpretation and verification. In this paper, we present Explainable Patterns (ExPatt), a new framework to support lay users in exploring and creating data storytellings, automatically generating plausible explanations for observed or selected findings using an external (textual) source of information, avoiding or reducing the need for domain experts. ExPatt applicability is confirmed via different use-cases involving world demographics indicators and Wikipedia as an external source of explanations, showing how it can be used in practice towards the data analytics democratization.
Explainable Matrix -- Visualization for Global and Local Interpretability of Random Forest Classification Ensembles
May 08, 2020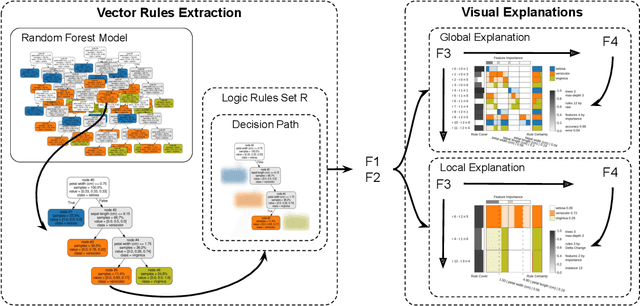
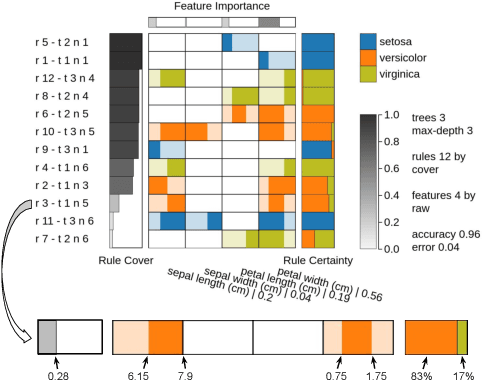

Abstract:Over the past decades, classification models have proven to be one of the essential machine learning tools given their potential and applicability in various domains. In these years, the north of the majority of the researchers had been to improve quality metrics, notwithstanding the lack of information about models' decisions such metrics convey. Recently, this paradigm has shifted, and strategies that go beyond tables and numbers to assist in interpreting models' decisions are increasing in importance. Part of this trend, visualization techniques have been extensively used to support the interpretability of classification models, with a significant focus on rule-based techniques. Despite the advances, the existing visualization approaches present limitations in terms of visual scalability, and large and complex models, such as the ones produced by the Random Forest (RF) technique, cannot be entirely visualized without losing context. In this paper, we propose Explainable Matrix (ExMatrix), a novel visualization method for RF interpretability that can handle models with massive quantities of rules. It employs a simple yet powerful matrix-like visual metaphor, where rows are rules, columns are features, and cells are rules predicates, enabling the analysis of entire models and auditing classification results. ExMatrix applicability is confirmed via different usage scenarios, showing how it can be used in practice to increase trust in the classification models.
Xtreaming: an incremental multidimensional projection technique and its application to streaming data
Mar 08, 2020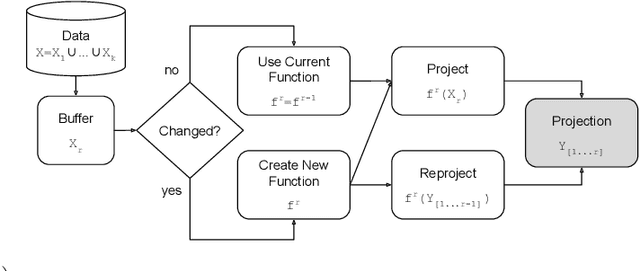

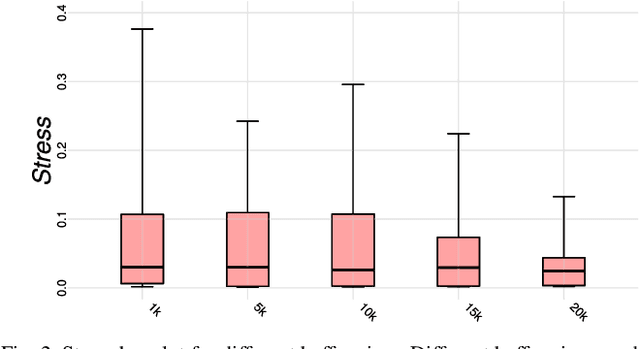
Abstract:Streaming data applications are becoming more common due to the ability of different information sources to continuously capture or produce data, such as sensors and social media. Despite recent advances, most visualization approaches, in particular, multidimensional projection or dimensionality reduction techniques, cannot be directly applied in such scenarios due to the transient nature of streaming data. Currently, only a few methods address this limitation using online or incremental strategies, continuously processing data, and updating the visualization. Despite their relative success, most of them impose the need for storing and accessing the data multiple times, not being appropriate for streaming where data continuously grow. Others do not impose such requirements but are not capable of updating the position of the data already projected, potentially resulting in visual artifacts. In this paper, we present Xtreaming, a novel incremental projection technique that continuously updates the visual representation to reflect new emerging structures or patterns without visiting the multidimensional data more than once. Our tests show that Xtreaming is competitive in terms of global distance preservation if compared to other streaming and incremental techniques, but it is orders of magnitude faster. To the best of our knowledge, it is the first methodology that is capable of evolving a projection to faithfully represent new emerging structures without the need to store all data, providing reliable results for efficiently and effectively projecting streaming data.
Distance Preserving Grid Layouts
Mar 08, 2019


Abstract:Distance preserving visualization techniques have emerged as one of the fundamental tools for data analysis. One example are the techniques that arrange data instances into two-dimensional grids so that the pairwise distances among the instances are preserved into the produced layouts. Currently, the state-of-the-art approaches produce such grids by solving assignment problems or using permutations to optimize cost functions. Although precise, such strategies are computationally expensive, limited to small datasets or being dependent on specialized hardware to speed up the process. In this paper, we present a new technique, called Distance-preserving Grid (DGrid), that employs a binary space partitioning process in combination with multidimensional projections to create orthogonal regular grid layouts. Our results show that DGrid is as precise as the existing state-of-the-art techniques whereas requiring only a fraction of the running time and computational resources.
 Add to Chrome
 Add to Firefox
 Add to Edge