Mário Popolin Neto
Multivariate Data Explanation by Jumping Emerging Patterns Visualization
Jun 21, 2021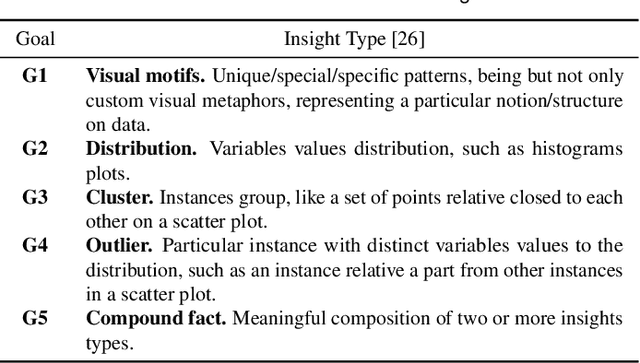

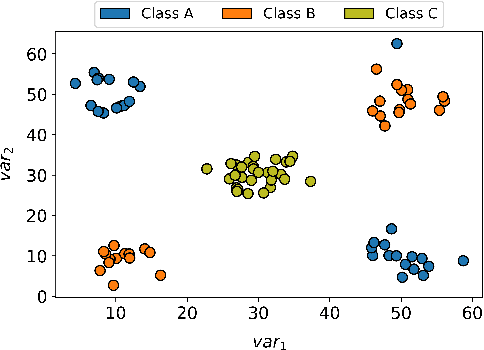
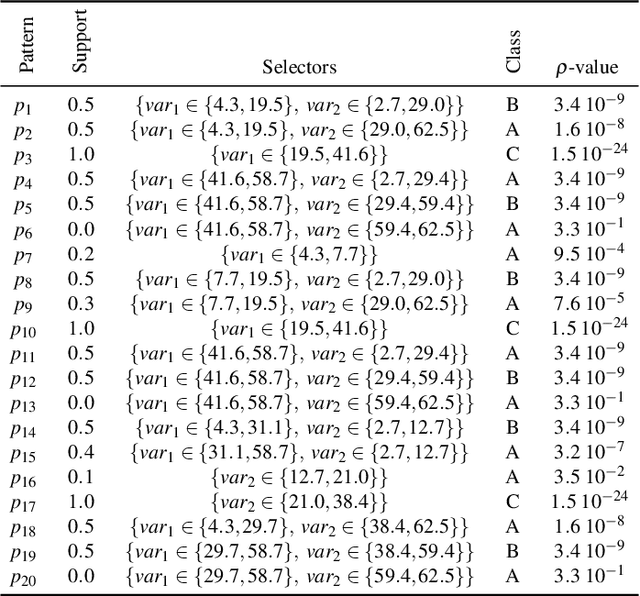
Abstract:Visual Analytics (VA) tools and techniques have shown to be instrumental in supporting users to build better classification models, interpret model decisions and audit results. In a different direction, VA has recently been applied to transform classification models into descriptive mechanisms instead of predictive. The idea is to use such models as surrogates for data patterns, visualizing the model to understand the phenomenon represented by the data. Although very useful and inspiring, the few proposed approaches have opted to use low complex classification models to promote straightforward interpretation, presenting limitations to capture intricate data patterns. In this paper, we present VAX (multiVariate dAta eXplanation), a new VA method to support the identification and visual interpretation of patterns in multivariate data sets. Unlike the existing similar approaches, VAX uses the concept of Jumping Emerging Patterns to identify and aggregate several diversified patterns, producing explanations through logic combinations of data variables. The potential of VAX to interpret complex multivariate datasets is demonstrated through study-cases using two real-world data sets covering different scenarios.
Explainable Matrix -- Visualization for Global and Local Interpretability of Random Forest Classification Ensembles
May 08, 2020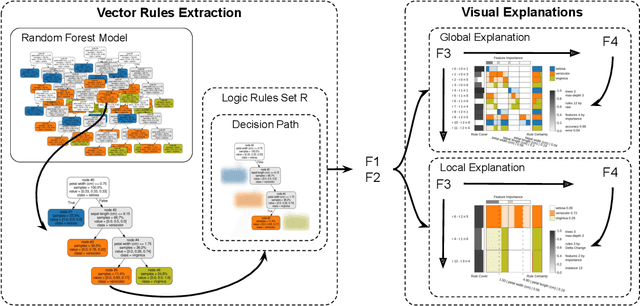
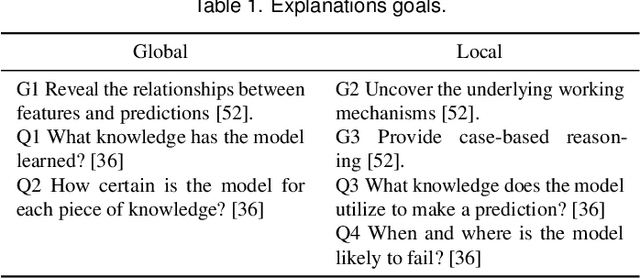
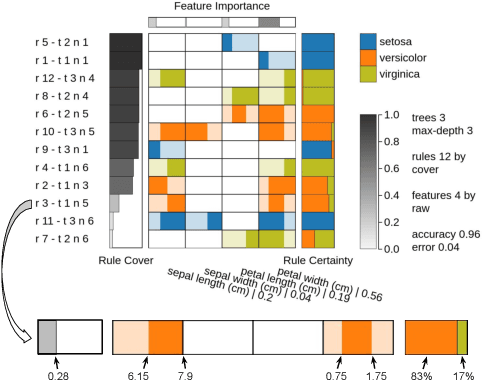

Abstract:Over the past decades, classification models have proven to be one of the essential machine learning tools given their potential and applicability in various domains. In these years, the north of the majority of the researchers had been to improve quality metrics, notwithstanding the lack of information about models' decisions such metrics convey. Recently, this paradigm has shifted, and strategies that go beyond tables and numbers to assist in interpreting models' decisions are increasing in importance. Part of this trend, visualization techniques have been extensively used to support the interpretability of classification models, with a significant focus on rule-based techniques. Despite the advances, the existing visualization approaches present limitations in terms of visual scalability, and large and complex models, such as the ones produced by the Random Forest (RF) technique, cannot be entirely visualized without losing context. In this paper, we propose Explainable Matrix (ExMatrix), a novel visualization method for RF interpretability that can handle models with massive quantities of rules. It employs a simple yet powerful matrix-like visual metaphor, where rows are rules, columns are features, and cells are rules predicates, enabling the analysis of entire models and auditing classification results. ExMatrix applicability is confirmed via different usage scenarios, showing how it can be used in practice to increase trust in the classification models.
 Add to Chrome
 Add to Firefox
 Add to Edge