FeatureEnVi: Visual Analytics for Feature Engineering Using Stepwise Selection and Semi-Automatic Extraction Approaches
Paper and Code
Mar 26, 2021


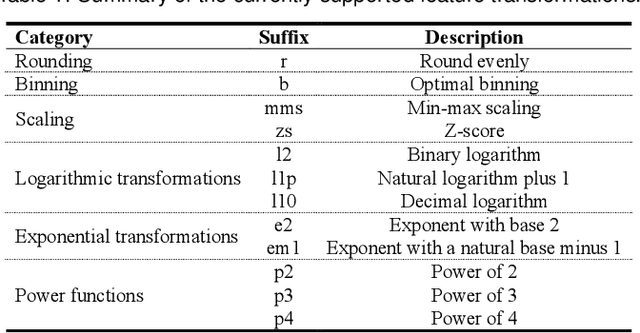
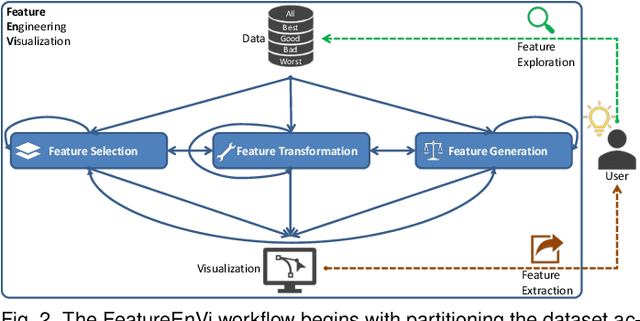
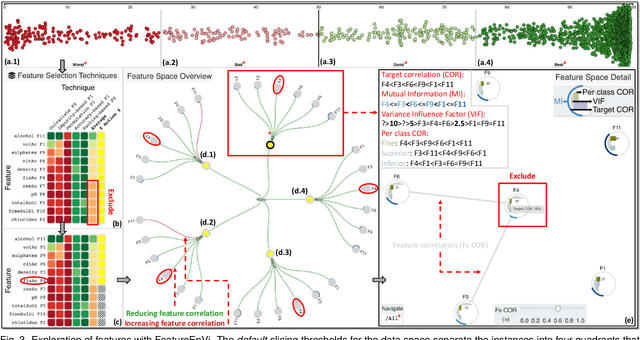
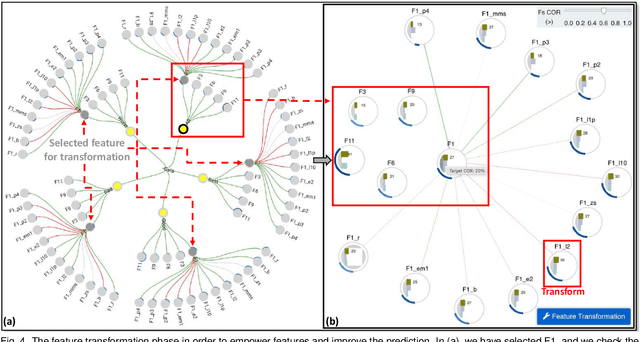
The machine learning (ML) life cycle involves a series of iterative steps, from the effective gathering and preparation of the data, including complex feature engineering processes, to the presentation and improvement of results, with various algorithms to choose from in every step. Feature engineering in particular can be very beneficial for ML, leading to numerous improvements such as boosting the predictive results, decreasing computational times, reducing excessive noise, and increasing the transparency behind the decisions taken during the training. Despite that, while several visual analytics tools exist to monitor and control the different stages of the ML life cycle (especially those related to data and algorithms), feature engineering support remains inadequate. In this paper, we present FeatureEnVi, a visual analytics system specifically designed to assist with the feature engineering process. Our proposed system helps users to choose the most important feature, to transform the original features into powerful alternatives, and to experiment with different feature generation combinations. Additionally, data space slicing allows users to explore the impact of features on both local and global scales. FeatureEnVi utilizes multiple automatic feature selection techniques; furthermore, it visually guides users with statistical evidence about the influence of each feature (or subsets of features). The final outcome is the extraction of heavily engineered features, evaluated by multiple validation metrics. The usefulness and applicability of FeatureEnVi are demonstrated with two use cases, using a popular red wine quality data set and publicly available data related to vehicle recognition from their silhouettes. We also report feedback from interviews with ML experts and a visualization researcher who assessed the effectiveness of our system.
 Add to Chrome
 Add to Firefox
 Add to Edge