Takanori Fujiwara
MAPLE: Self-supervised Learning-Enhanced Nonlinear Dimensionality Reduction for Visual Analysis
Jan 28, 2026Abstract:We present a new nonlinear dimensionality reduction method, MAPLE, that enhances UMAP by improving manifold modeling. MAPLE employs a self-supervised learning approach to more efficiently encode low-dimensional manifold geometry. Central to this approach are maximum manifold capacity representations (MMCRs), which help untangle complex manifolds by compressing variances among locally similar data points while amplifying variance among dissimilar data points. This design is particularly effective for high-dimensional data with substantial intra-cluster variance and curved manifold structures, such as biological or image data. Our qualitative and quantitative evaluations demonstrate that MAPLE can produce clearer visual cluster separations and finer subcluster resolution than UMAP while maintaining comparable computational cost.
GhostUMAP2: Measuring and Analyzing (r,d)-Stability of UMAP
Jul 23, 2025Abstract:Despite the widespread use of Uniform Manifold Approximation and Projection (UMAP), the impact of its stochastic optimization process on the results remains underexplored. We observed that it often produces unstable results where the projections of data points are determined mostly by chance rather than reflecting neighboring structures. To address this limitation, we introduce (r,d)-stability to UMAP: a framework that analyzes the stochastic positioning of data points in the projection space. To assess how stochastic elements, specifically initial projection positions and negative sampling, impact UMAP results, we introduce "ghosts", or duplicates of data points representing potential positional variations due to stochasticity. We define a data point's projection as (r,d)-stable if its ghosts perturbed within a circle of radius r in the initial projection remain confined within a circle of radius d for their final positions. To efficiently compute the ghost projections, we develop an adaptive dropping scheme that reduces a runtime up to 60% compared to an unoptimized baseline while maintaining approximately 90% of unstable points. We also present a visualization tool that supports the interactive exploration of the (r,d)-stability of data points. Finally, we demonstrate the effectiveness of our framework by examining the stability of projections of real-world datasets and present usage guidelines for the effective use of our framework.
Adversarial Attacks on Machine Learning-Aided Visualizations
Sep 04, 2024Abstract:Research in ML4VIS investigates how to use machine learning (ML) techniques to generate visualizations, and the field is rapidly growing with high societal impact. However, as with any computational pipeline that employs ML processes, ML4VIS approaches are susceptible to a range of ML-specific adversarial attacks. These attacks can manipulate visualization generations, causing analysts to be tricked and their judgments to be impaired. Due to a lack of synthesis from both visualization and ML perspectives, this security aspect is largely overlooked by the current ML4VIS literature. To bridge this gap, we investigate the potential vulnerabilities of ML-aided visualizations from adversarial attacks using a holistic lens of both visualization and ML perspectives. We first identify the attack surface (i.e., attack entry points) that is unique in ML-aided visualizations. We then exemplify five different adversarial attacks. These examples highlight the range of possible attacks when considering the attack surface and multiple different adversary capabilities. Our results show that adversaries can induce various attacks, such as creating arbitrary and deceptive visualizations, by systematically identifying input attributes that are influential in ML inferences. Based on our observations of the attack surface characteristics and the attack examples, we underline the importance of comprehensive studies of security issues and defense mechanisms as a call of urgency for the ML4VIS community.
Visual Analytics of Multivariate Networks with Representation Learning and Composite Variable Construction
Mar 16, 2023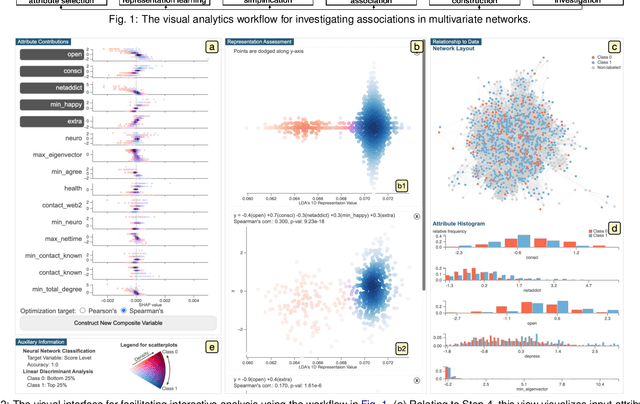


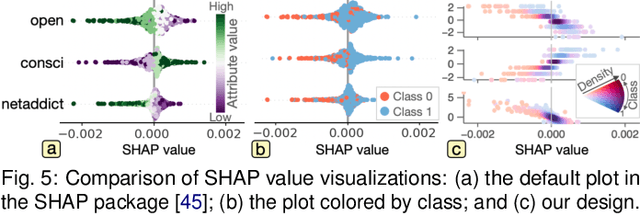
Abstract:Multivariate networks are commonly found in real-world data-driven applications. Uncovering and understanding the relations of interest in multivariate networks is not a trivial task. This paper presents a visual analytics workflow for studying multivariate networks to extract associations between different structural and semantic characteristics of the networks (e.g., what are the combinations of attributes largely relating to the density of a social network?). The workflow consists of a neural-network-based learning phase to classify the data based on the chosen input and output attributes, a dimensionality reduction and optimization phase to produce a simplified set of results for examination, and finally an interpreting phase conducted by the user through an interactive visualization interface. A key part of our design is a composite variable construction step that remodels nonlinear features obtained by neural networks into linear features that are intuitive to interpret. We demonstrate the capabilities of this workflow with multiple case studies on networks derived from social media usage and also evaluate the workflow through an expert interview.
Visual Analytics of Neuron Vulnerability to Adversarial Attacks on Convolutional Neural Networks
Mar 06, 2023Abstract:Adversarial attacks on a convolutional neural network (CNN) -- injecting human-imperceptible perturbations into an input image -- could fool a high-performance CNN into making incorrect predictions. The success of adversarial attacks raises serious concerns about the robustness of CNNs, and prevents them from being used in safety-critical applications, such as medical diagnosis and autonomous driving. Our work introduces a visual analytics approach to understanding adversarial attacks by answering two questions: (1) which neurons are more vulnerable to attacks and (2) which image features do these vulnerable neurons capture during the prediction? For the first question, we introduce multiple perturbation-based measures to break down the attacking magnitude into individual CNN neurons and rank the neurons by their vulnerability levels. For the second, we identify image features (e.g., cat ears) that highly stimulate a user-selected neuron to augment and validate the neuron's responsibility. Furthermore, we support an interactive exploration of a large number of neurons by aiding with hierarchical clustering based on the neurons' roles in the prediction. To this end, a visual analytics system is designed to incorporate visual reasoning for interpreting adversarial attacks. We validate the effectiveness of our system through multiple case studies as well as feedback from domain experts.
Feature Learning for Dimensionality Reduction toward Maximal Extraction of Hidden Patterns
Jun 28, 2022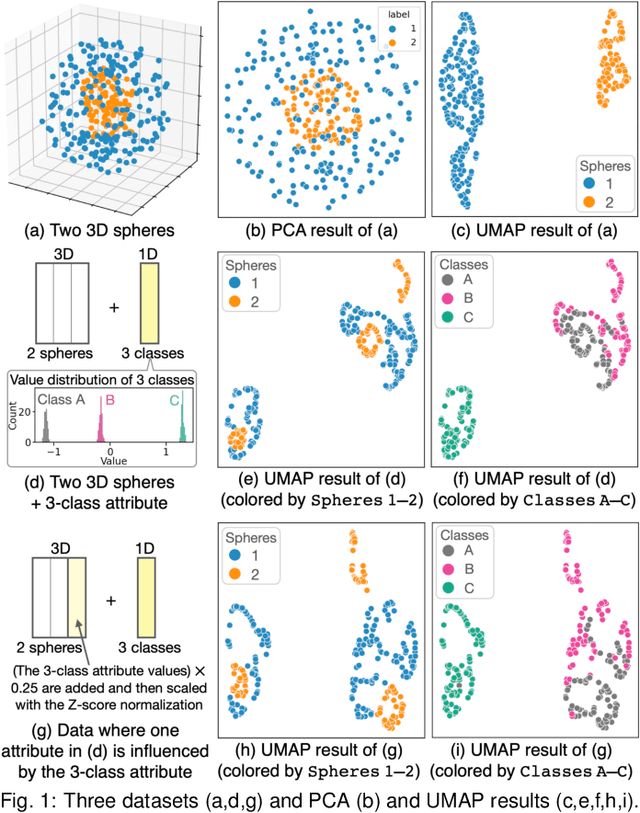
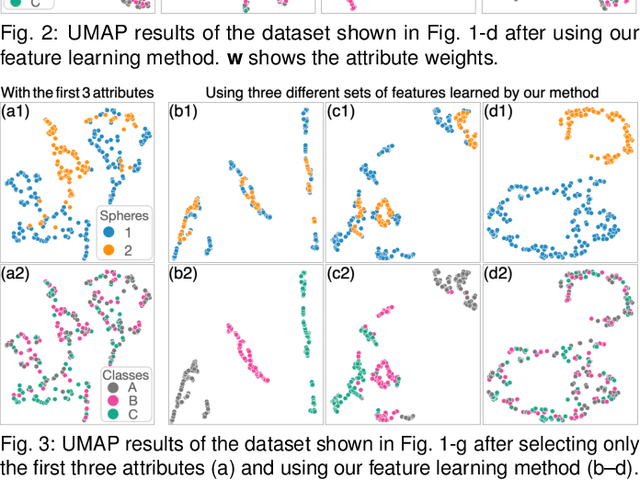
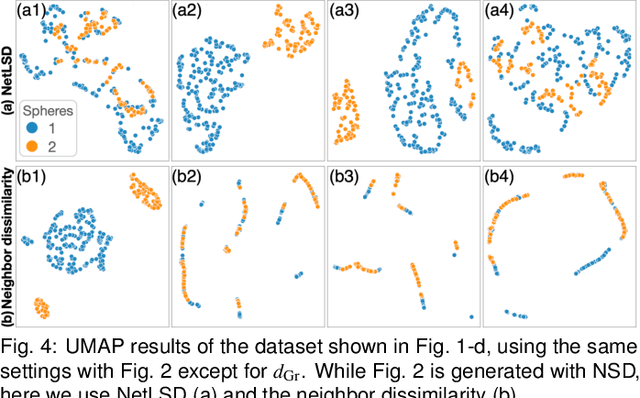
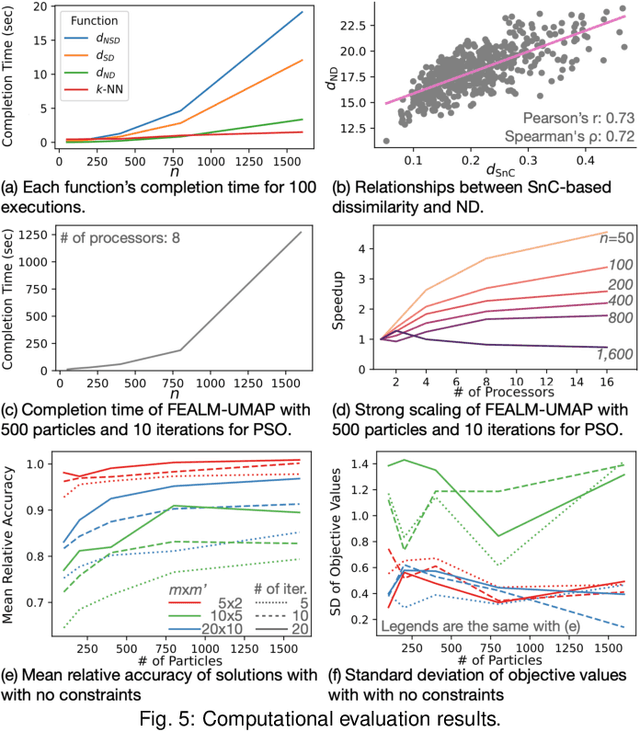
Abstract:Dimensionality reduction (DR) plays a vital role in the visual analysis of high-dimensional data. One main aim of DR is to reveal hidden patterns that lie on intrinsic low-dimensional manifolds. However, DR often overlooks important patterns when the manifolds are strongly distorted or hidden by certain influential data attributes. This paper presents a feature learning framework, FEALM, designed to generate an optimized set of data projections for nonlinear DR in order to capture important patterns in the hidden manifolds. These projections produce maximally different nearest-neighbor graphs so that resultant DR outcomes are significantly different. To achieve such a capability, we design an optimization algorithm as well as introduce a new graph dissimilarity measure, called neighbor-shape dissimilarity. Additionally, we develop interactive visualizations to assist comparison of obtained DR results and interpretation of each DR result. We demonstrate FEALM's effectiveness through experiments using synthetic datasets and multiple case studies on real-world datasets.
A Machine-Learning-Aided Visual Analysis Workflow for Investigating Air Pollution Data
Feb 11, 2022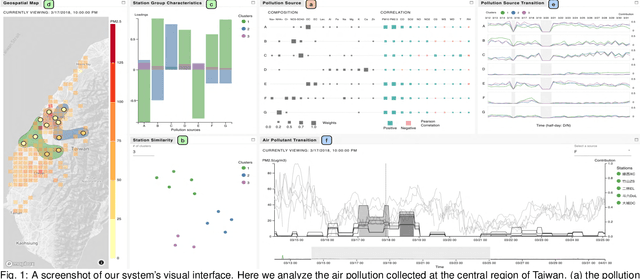
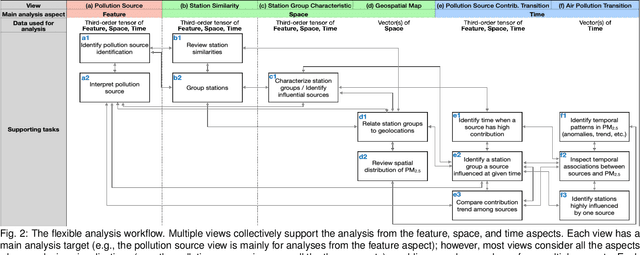
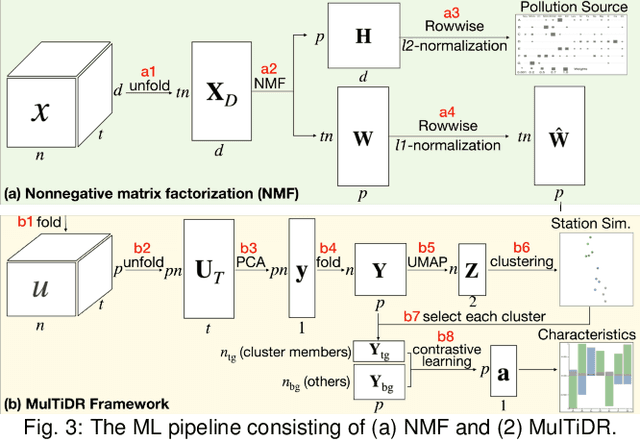
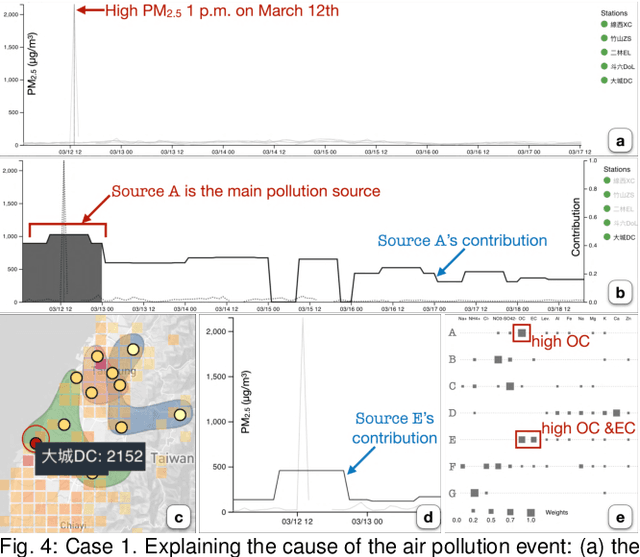
Abstract:Analyzing air pollution data is challenging as there are various analysis focuses from different aspects: feature (what), space (where), and time (when). As in most geospatial analysis problems, besides high-dimensional features, the temporal and spatial dependencies of air pollution induce the complexity of performing analysis. Machine learning methods, such as dimensionality reduction, can extract and summarize important information of the data to lift the burden of understanding such a complicated environment. In this paper, we present a methodology that utilizes multiple machine learning methods to uniformly explore these aspects. With this methodology, we develop a visual analytic system that supports a flexible analysis workflow, allowing domain experts to freely explore different aspects based on their analysis needs. We demonstrate the capability of our system and analysis workflow supporting a variety of analysis tasks with multiple use cases.
Interactive Dimensionality Reduction for Comparative Analysis
Jun 29, 2021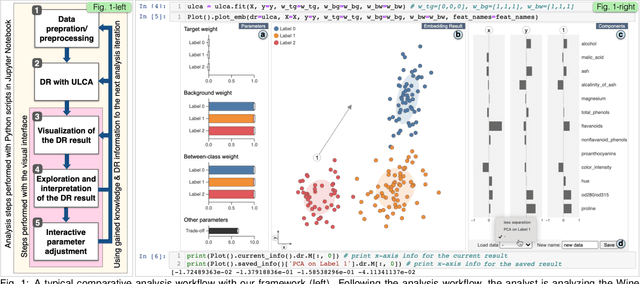
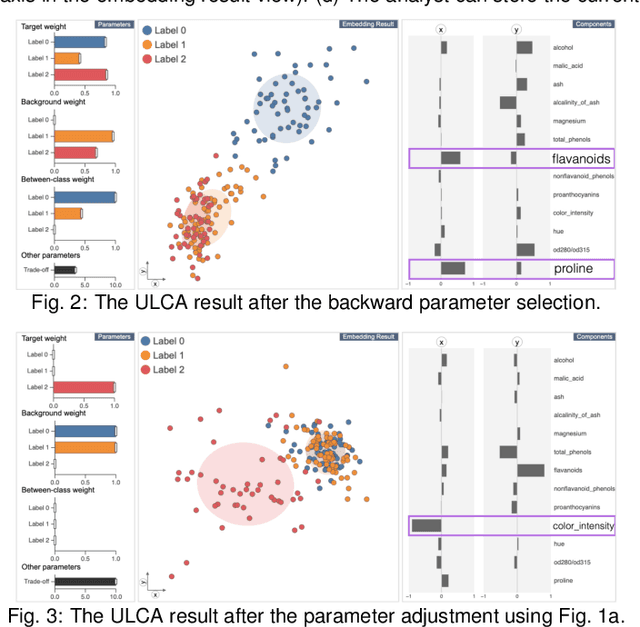
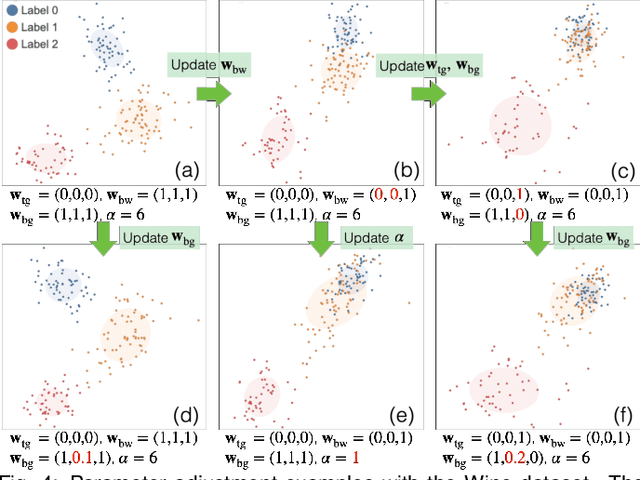
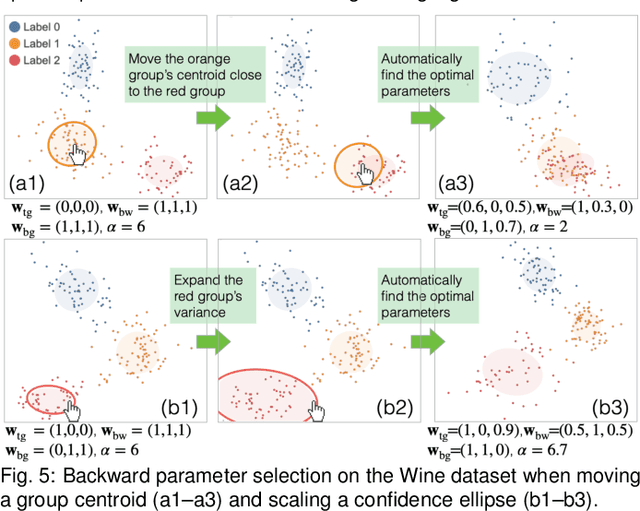
Abstract:Finding the similarities and differences between two or more groups of datasets is a fundamental analysis task. For high-dimensional data, dimensionality reduction (DR) methods are often used to find the characteristics of each group. However, existing DR methods provide limited capability and flexibility for such comparative analysis as each method is designed only for a narrow analysis target, such as identifying factors that most differentiate groups. In this work, we introduce an interactive DR framework where we integrate our new DR method, called ULCA (unified linear comparative analysis), with an interactive visual interface. ULCA unifies two DR schemes, discriminant analysis and contrastive learning, to support various comparative analysis tasks. To provide flexibility for comparative analysis, we develop an optimization algorithm that enables analysts to interactively refine ULCA results. Additionally, we provide an interactive visualization interface to examine ULCA results with a rich set of analysis libraries. We evaluate ULCA and the optimization algorithm to show their efficiency as well as present multiple case studies using real-world datasets to demonstrate the usefulness of our framework.
A Visual Analytics Framework for Contrastive Network Analysis
Aug 17, 2020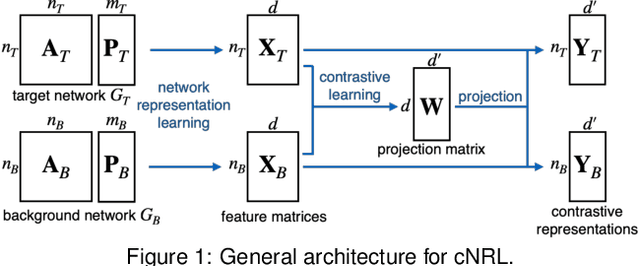
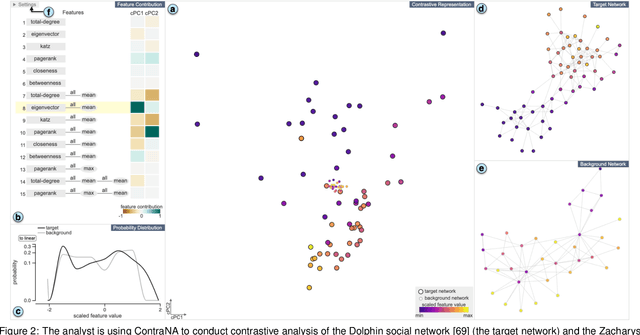
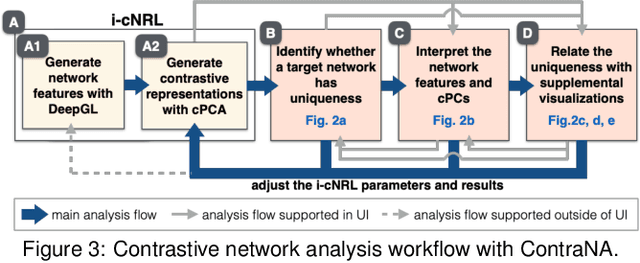
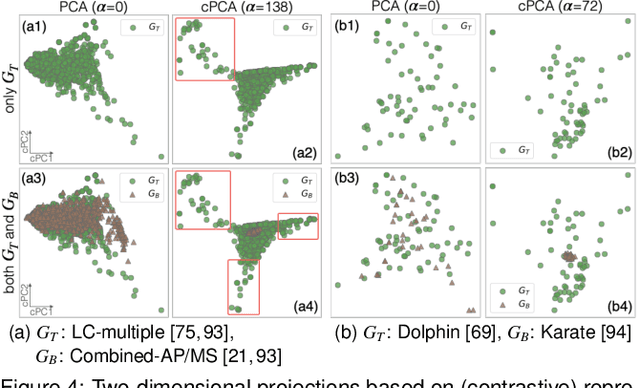
Abstract:A common network analysis task is comparison of two networks to identify unique characteristics in one network with respect to the other. For example, when comparing protein interaction networks derived from normal and cancer tissues, one essential task is to discover protein-protein interactions unique to cancer tissues. However, this task is challenging when the networks contain complex structural (and semantic) relations. To address this problem, we design ContraNA, a visual analytics framework leveraging both the power of machine learning for uncovering unique characteristics in networks and also the effectiveness of visualization for understanding such uniqueness. The basis of ContraNA is cNRL, which integrates two machine learning schemes, network representation learning (NRL) and contrastive learning (CL), to generate a low-dimensional embedding that reveals the uniqueness of one network when compared to another. ContraNA provides an interactive visualization interface to help analyze the uniqueness by relating embedding results and network structures as well as explaining the learned features by cNRL. We demonstrate the usefulness of ContraNA with two case studies using real-world datasets. We also evaluate through a controlled user study with 12 participants on network comparison tasks. The results show that participants were able to both effectively identify unique characteristics from complex networks and interpret the results obtained from cNRL.
A Visual Analytics Framework for Reviewing Multivariate Time-Series Data with Dimensionality Reduction
Aug 17, 2020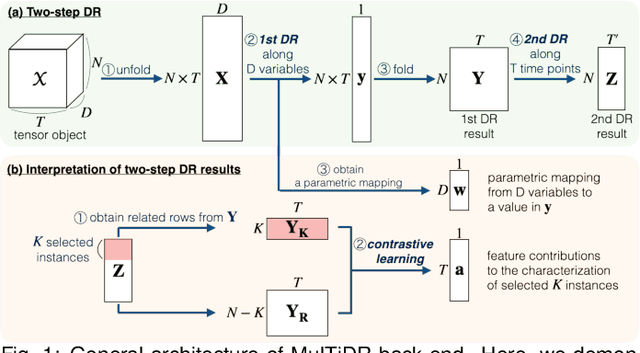
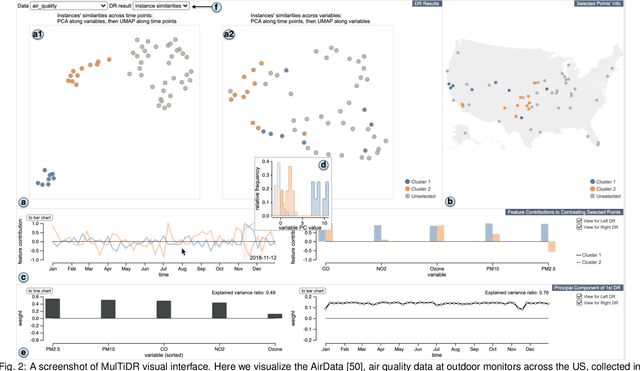
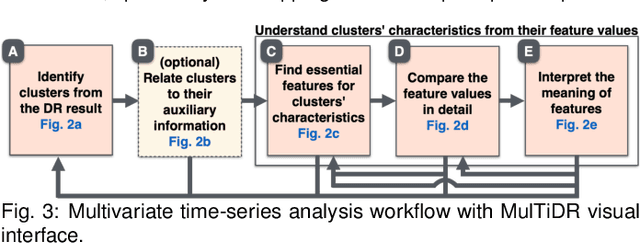
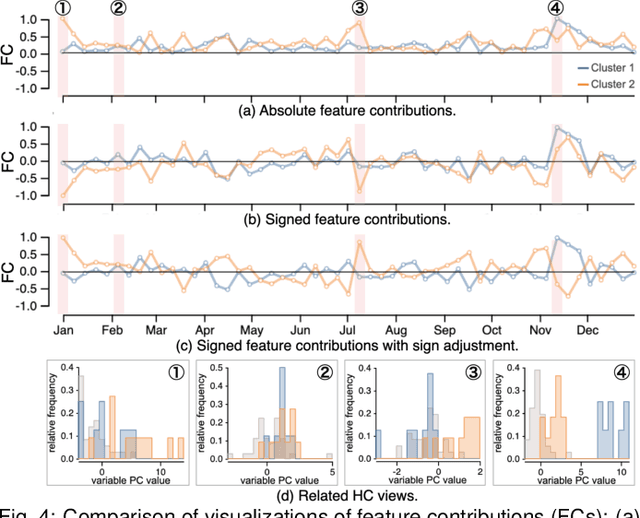
Abstract:Data-driven problem solving in many real-world applications involves analysis of time-dependent multivariate data, for which dimensionality reduction (DR) methods are often used to uncover the intrinsic structure and features of the data. However, DR is usually applied to a subset of data that is either single-time-point multivariate or univariate time-series, resulting in the need to manually examine and correlate the DR results out of different data subsets. When the number of dimensions is large either in terms of the number of time points or attributes, this manual task becomes too tedious and infeasible. In this paper, we present MulTiDR, a new DR framework that enables processing of time-dependent multivariate data as a whole to provide a comprehensive overview of the data. With the framework, we employ DR in two steps. When treating the instances, time points, and attributes of the data as a 3D array, the first DR step reduces the three axes of the array to two, and the second DR step visualizes the data in a lower-dimensional space. In addition, by coupling with a contrastive learning method and interactive visualizations, our framework enhances analysts' ability to interpret DR results. We demonstrate the effectiveness of our framework with four case studies using real-world datasets.
 Add to Chrome
 Add to Firefox
 Add to Edge