Chun-houh Chen
A Machine-Learning-Aided Visual Analysis Workflow for Investigating Air Pollution Data
Feb 11, 2022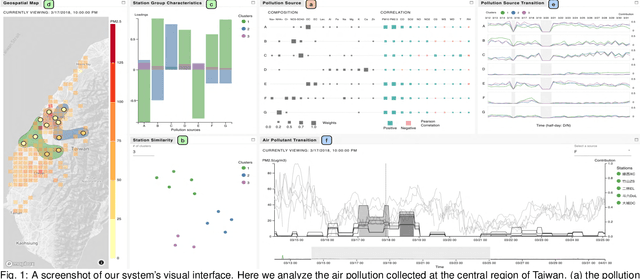
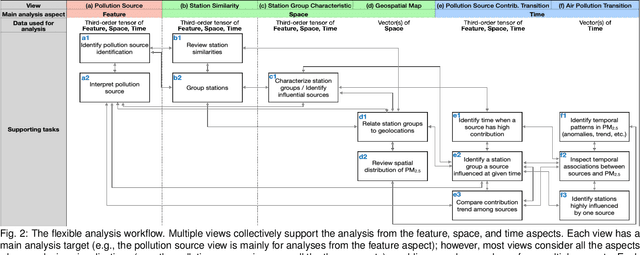
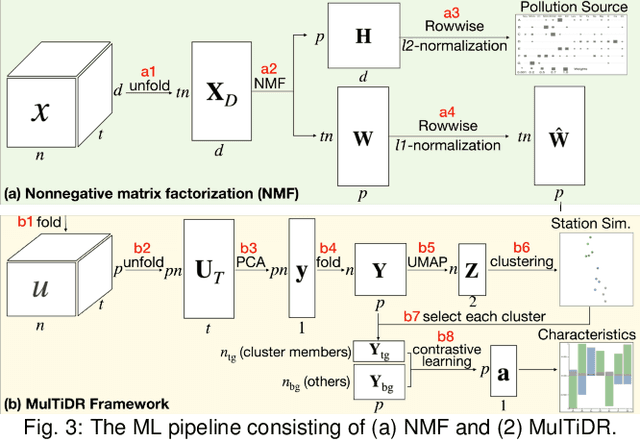
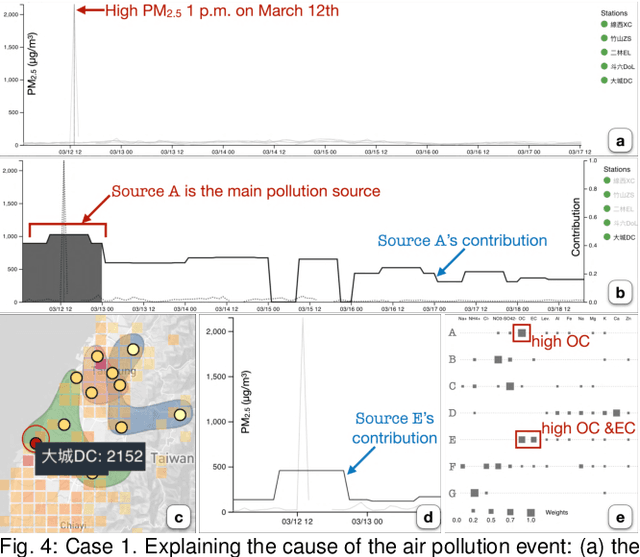
Abstract:Analyzing air pollution data is challenging as there are various analysis focuses from different aspects: feature (what), space (where), and time (when). As in most geospatial analysis problems, besides high-dimensional features, the temporal and spatial dependencies of air pollution induce the complexity of performing analysis. Machine learning methods, such as dimensionality reduction, can extract and summarize important information of the data to lift the burden of understanding such a complicated environment. In this paper, we present a methodology that utilizes multiple machine learning methods to uniformly explore these aspects. With this methodology, we develop a visual analytic system that supports a flexible analysis workflow, allowing domain experts to freely explore different aspects based on their analysis needs. We demonstrate the capability of our system and analysis workflow supporting a variety of analysis tasks with multiple use cases.
A Deep Generative Model for Matrix Reordering
Oct 11, 2021
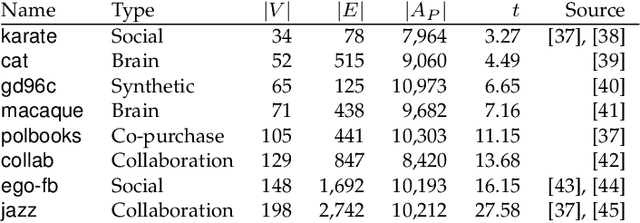

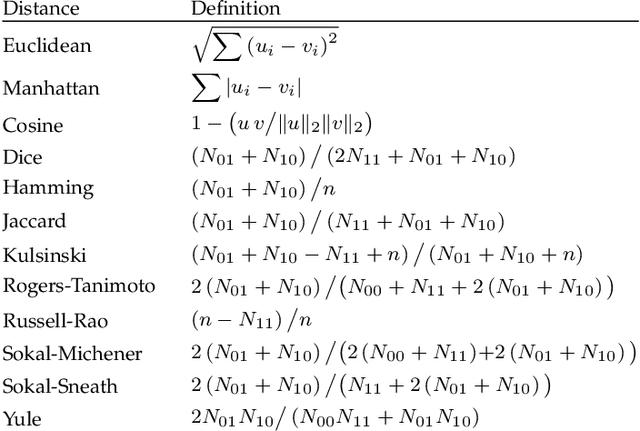
Abstract:Depending on the node ordering, an adjacency matrix can highlight distinct characteristics of a graph. Deriving a "proper" node ordering is thus a critical step in visualizing a graph as an adjacency matrix. Users often try multiple matrix reorderings using different methods until they find one that meets the analysis goal. However, this trial-and-error approach is laborious and disorganized, which is especially challenging for novices. This paper presents a technique that enables users to effortlessly find a matrix reordering they want. Specifically, we design a generative model that learns a latent space of diverse matrix reorderings of the given graph. We also construct an intuitive user interface from the learned latent space by creating a map of various matrix reorderings. We demonstrate our approach through quantitative and qualitative evaluations of the generated reorderings and learned latent spaces. The results show that our model is capable of learning a latent space of diverse matrix reorderings. Most existing research in this area generally focused on developing algorithms that can compute "better" matrix reorderings for particular circumstances. This paper introduces a fundamentally new approach to matrix visualization of a graph, where a machine learning model learns to generate diverse matrix reorderings of a graph.
 Add to Chrome
 Add to Firefox
 Add to Edge