Visual Analytics of Multivariate Networks with Representation Learning and Composite Variable Construction
Paper and Code
Mar 16, 2023


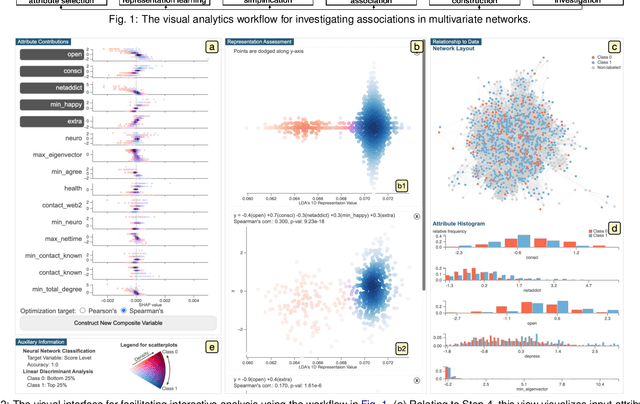
Multivariate networks are commonly found in real-world data-driven applications. Uncovering and understanding the relations of interest in multivariate networks is not a trivial task. This paper presents a visual analytics workflow for studying multivariate networks to extract associations between different structural and semantic characteristics of the networks (e.g., what are the combinations of attributes largely relating to the density of a social network?). The workflow consists of a neural-network-based learning phase to classify the data based on the chosen input and output attributes, a dimensionality reduction and optimization phase to produce a simplified set of results for examination, and finally an interpreting phase conducted by the user through an interactive visualization interface. A key part of our design is a composite variable construction step that remodels nonlinear features obtained by neural networks into linear features that are intuitive to interpret. We demonstrate the capabilities of this workflow with multiple case studies on networks derived from social media usage and also evaluate the workflow through an expert interview.
 Add to Chrome
 Add to Firefox
 Add to Edge