Hsiao-Ying Lu
GNNAnatomy: Systematic Generation and Evaluation of Multi-Level Explanations for Graph Neural Networks
Jun 06, 2024


Abstract:Graph Neural Networks (GNNs) have proven highly effective in various machine learning (ML) tasks involving graphs, such as node/graph classification and link prediction. However, explaining the decisions made by GNNs poses challenges because of the aggregated relational information based on graph structure, leading to complex data transformations. Existing methods for explaining GNNs often face limitations in systematically exploring diverse substructures and evaluating results in the absence of ground truths. To address this gap, we introduce GNNAnatomy, a model- and dataset-agnostic visual analytics system designed to facilitate the generation and evaluation of multi-level explanations for GNNs. In GNNAnatomy, we employ graphlets to elucidate GNN behavior in graph-level classification tasks. By analyzing the associations between GNN classifications and graphlet frequencies, we formulate hypothesized factual and counterfactual explanations. To validate a hypothesized graphlet explanation, we introduce two metrics: (1) the correlation between its frequency and the classification confidence, and (2) the change in classification confidence after removing this substructure from the original graph. To demonstrate the effectiveness of GNNAnatomy, we conduct case studies on both real-world and synthetic graph datasets from various domains. Additionally, we qualitatively compare GNNAnatomy with a state-of-the-art GNN explainer, demonstrating the utility and versatility of our design.
A Visual Analytics Design for Connecting Healthcare Team Communication to Patient Outcomes
Jan 08, 2024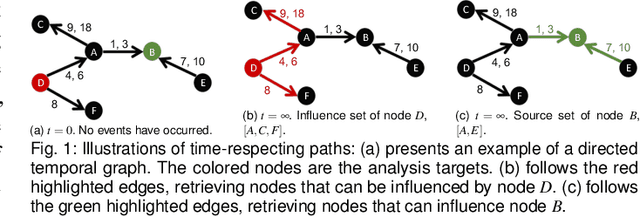
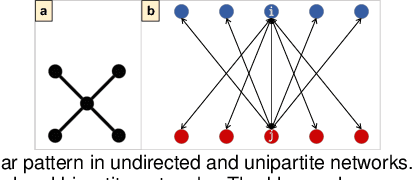

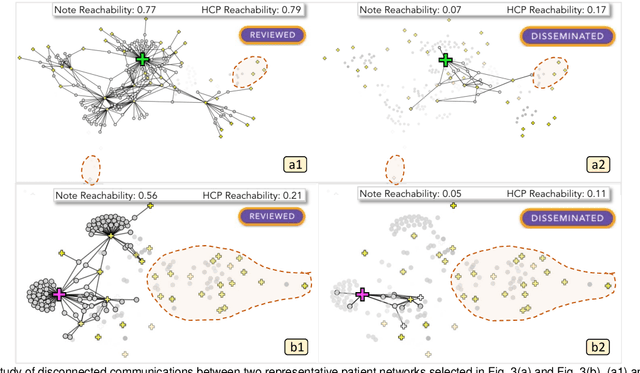
Abstract:Communication among healthcare professionals (HCPs) is crucial for the quality of patient treatment. Surrounding each patient's treatment, communication among HCPs can be examined as temporal networks, constructed from Electronic Health Record (EHR) access logs. This paper introduces a visual analytics system designed to study the effectiveness and efficiency of temporal communication networks mediated by the EHR system. We present a method that associates network measures with patient survival outcomes and devises effectiveness metrics based on these associations. To analyze communication efficiency, we extract the latencies and frequencies of EHR accesses. Our visual analytics system is designed to assist in inspecting and understanding the composed communication effectiveness metrics and to enable the exploration of communication efficiency by encoding latencies and frequencies in an information flow diagram. We demonstrate and evaluate our system through multiple case studies and an expert review.
Visual Analytics of Multivariate Networks with Representation Learning and Composite Variable Construction
Mar 16, 2023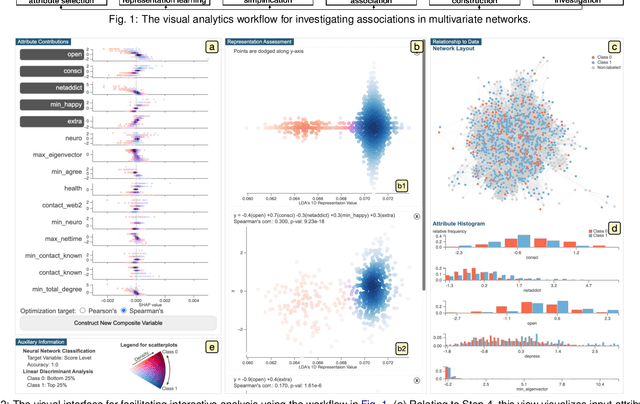


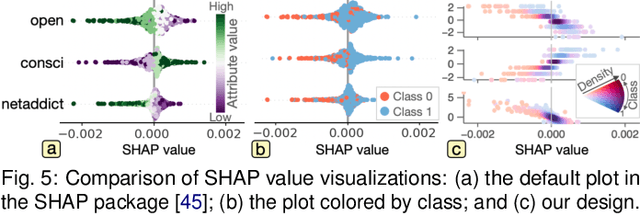
Abstract:Multivariate networks are commonly found in real-world data-driven applications. Uncovering and understanding the relations of interest in multivariate networks is not a trivial task. This paper presents a visual analytics workflow for studying multivariate networks to extract associations between different structural and semantic characteristics of the networks (e.g., what are the combinations of attributes largely relating to the density of a social network?). The workflow consists of a neural-network-based learning phase to classify the data based on the chosen input and output attributes, a dimensionality reduction and optimization phase to produce a simplified set of results for examination, and finally an interpreting phase conducted by the user through an interactive visualization interface. A key part of our design is a composite variable construction step that remodels nonlinear features obtained by neural networks into linear features that are intuitive to interpret. We demonstrate the capabilities of this workflow with multiple case studies on networks derived from social media usage and also evaluate the workflow through an expert interview.
 Add to Chrome
 Add to Firefox
 Add to Edge