Shilpika
A Multi-Level, Multi-Scale Visual Analytics Approach to Assessment of Multifidelity HPC Systems
Jun 15, 2023Abstract:The ability to monitor and interpret of hardware system events and behaviors are crucial to improving the robustness and reliability of these systems, especially in a supercomputing facility. The growing complexity and scale of these systems demand an increase in monitoring data collected at multiple fidelity levels and varying temporal resolutions. In this work, we aim to build a holistic analytical system that helps make sense of such massive data, mainly the hardware logs, job logs, and environment logs collected from disparate subsystems and components of a supercomputer system. This end-to-end log analysis system, coupled with visual analytics support, allows users to glean and promptly extract supercomputer usage and error patterns at varying temporal and spatial resolutions. We use multiresolution dynamic mode decomposition (mrDMD), a technique that depicts high-dimensional data as correlated spatial-temporal variations patterns or modes, to extract variation patterns isolated at specified frequencies. Our improvements to the mrDMD algorithm help promptly reveal useful information in the massive environment log dataset, which is then associated with the processed hardware and job log datasets using our visual analytics system. Furthermore, our system can identify the usage and error patterns filtered at user, project, and subcomponent levels. We exemplify the effectiveness of our approach with two use scenarios with the Cray XC40 supercomputer.
A Visual Analytics Framework for Reviewing Multivariate Time-Series Data with Dimensionality Reduction
Aug 17, 2020


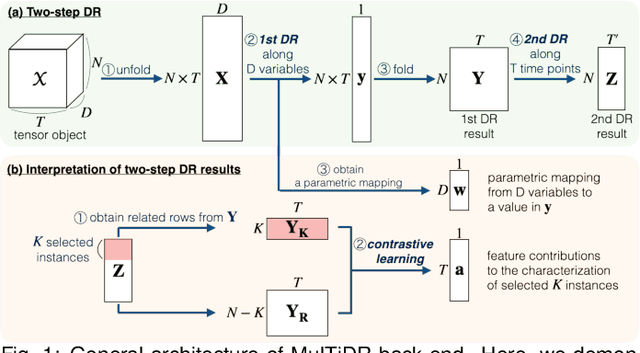
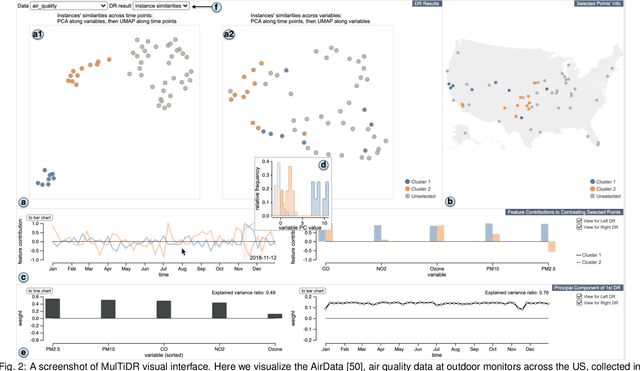
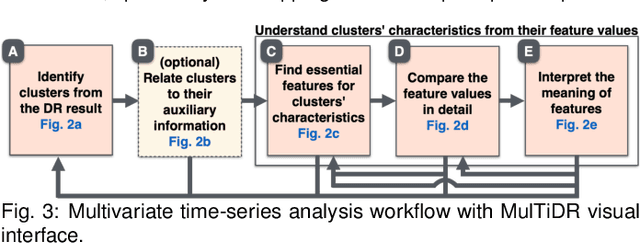
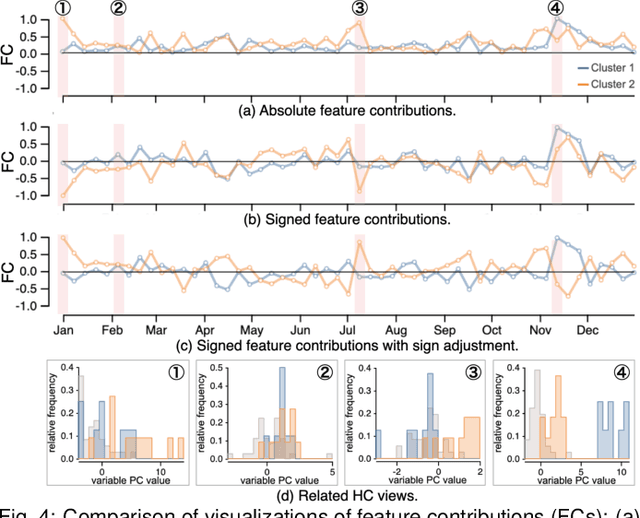
Abstract:Data-driven problem solving in many real-world applications involves analysis of time-dependent multivariate data, for which dimensionality reduction (DR) methods are often used to uncover the intrinsic structure and features of the data. However, DR is usually applied to a subset of data that is either single-time-point multivariate or univariate time-series, resulting in the need to manually examine and correlate the DR results out of different data subsets. When the number of dimensions is large either in terms of the number of time points or attributes, this manual task becomes too tedious and infeasible. In this paper, we present MulTiDR, a new DR framework that enables processing of time-dependent multivariate data as a whole to provide a comprehensive overview of the data. With the framework, we employ DR in two steps. When treating the instances, time points, and attributes of the data as a 3D array, the first DR step reduces the three axes of the array to two, and the second DR step visualizes the data in a lower-dimensional space. In addition, by coupling with a contrastive learning method and interactive visualizations, our framework enhances analysts' ability to interpret DR results. We demonstrate the effectiveness of our framework with four case studies using real-world datasets.
An Incremental Dimensionality Reduction Method for Visualizing Streaming Multidimensional Data
May 10, 2019


Abstract:Dimensionality reduction (DR) methods are commonly used for analyzing and visualizing multidimensional data. However, when data is a live streaming feed, conventional DR methods cannot be directly used because of their computational complexity and inability to preserve the projected data positions at previous time points. In addition, the problem becomes even more challenging when the dynamic data records have a varying number of dimensions as often found in real-world applications. This paper presents an incremental DR solution. We enhance an existing incremental PCA method in several ways to ensure its usability for visualizing streaming multidimensional data. First, we use geometric transformation and animation methods to help preserve a viewer's mental map when visualizing the incremental results. Second, to handle data dimension variants, we use an optimization method to estimate the projected data positions, and also convey the resulting uncertainty in the visualization. We demonstrate the effectiveness of our design with two case studies using real-world datasets.
 Add to Chrome
 Add to Firefox
 Add to Edge