Daniel Haehn
MRI Plane Orientation Detection using a Context-Aware 2.5D Model
Nov 18, 2025Abstract:Humans can easily identify anatomical planes (axial, coronal, and sagittal) on a 2D MRI slice, but automated systems struggle with this task. Missing plane orientation metadata can complicate analysis, increase domain shift when merging heterogeneous datasets, and reduce accuracy of diagnostic classifiers. This study develops a classifier that accurately generates plane orientation metadata. We adopt a 2.5D context-aware model that leverages multi-slice information to avoid ambiguity from isolated slices and enable robust feature learning. We train the 2.5D model on both 3D slice sequences and static 2D images. While our 2D reference model achieves 98.74% accuracy, our 2.5D method raises this to 99.49%, reducing errors by 60%, highlighting the importance of 2.5D context. We validate the utility of our generated metadata in a brain tumor detection task. A gated strategy selectively uses metadata-enhanced predictions based on uncertainty scores, boosting accuracy from 97.0% with an image-only model to 98.0%, reducing misdiagnoses by 33.3%. We integrate our plane orientation model into an interactive web application and provide it open-source.
Evaluating Graphical Perception with Multimodal LLMs
Apr 05, 2025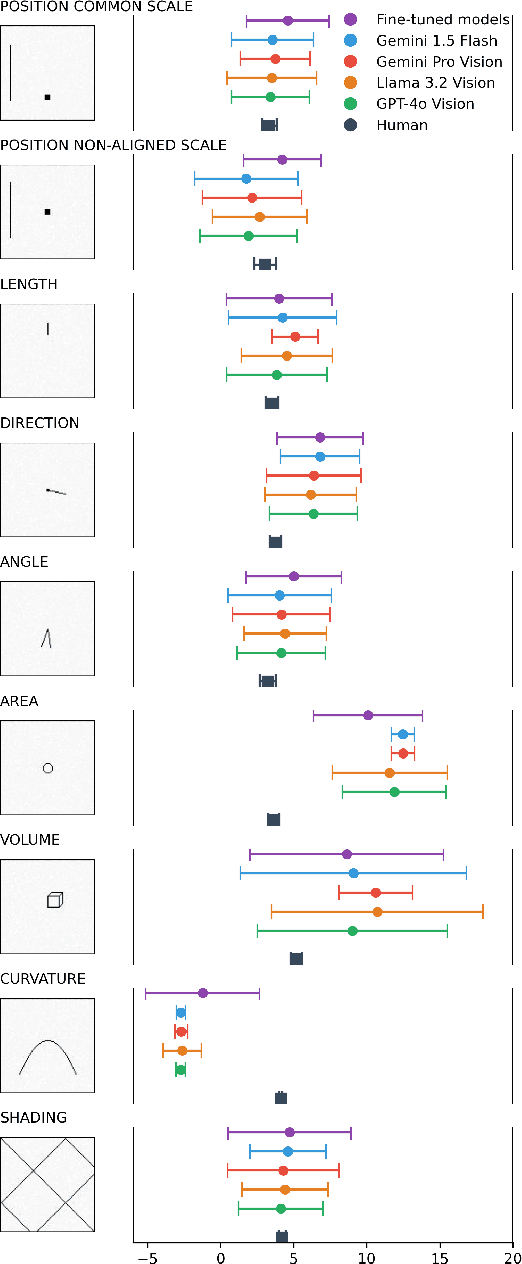
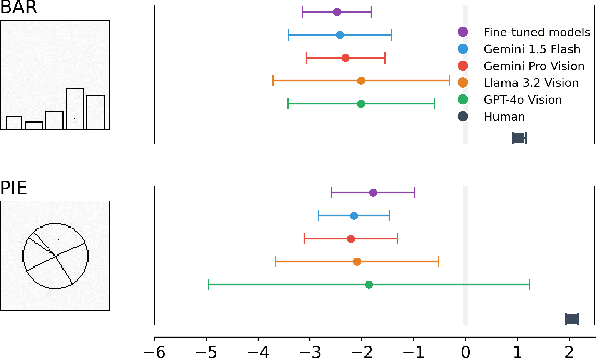
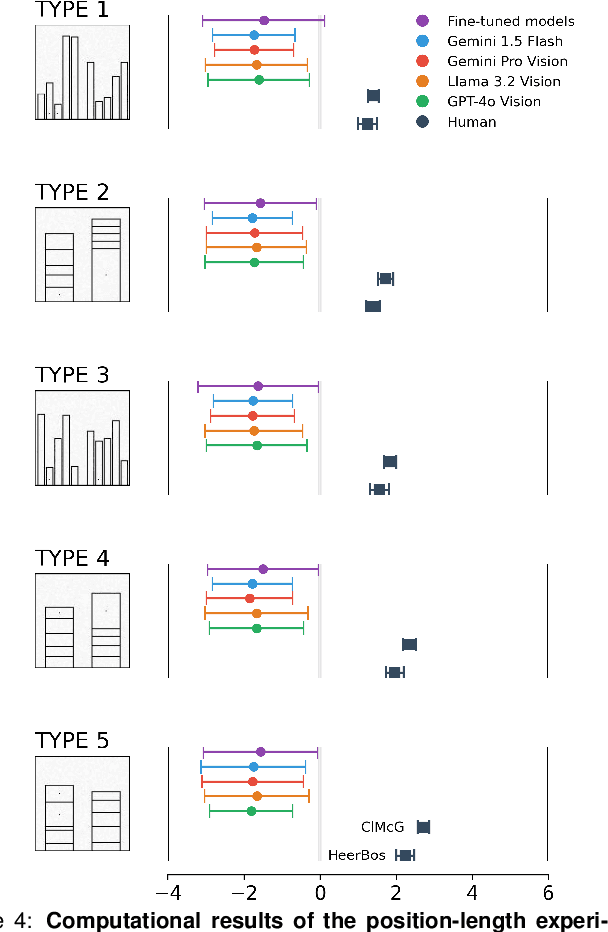
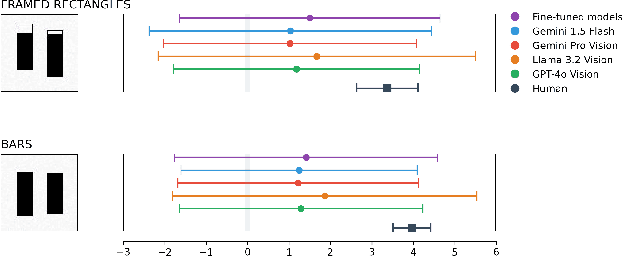
Abstract:Multimodal Large Language Models (MLLMs) have remarkably progressed in analyzing and understanding images. Despite these advancements, accurately regressing values in charts remains an underexplored area for MLLMs. For visualization, how do MLLMs perform when applied to graphical perception tasks? Our paper investigates this question by reproducing Cleveland and McGill's seminal 1984 experiment and comparing it against human task performance. Our study primarily evaluates fine-tuned and pretrained models and zero-shot prompting to determine if they closely match human graphical perception. Our findings highlight that MLLMs outperform human task performance in some cases but not in others. We highlight the results of all experiments to foster an understanding of where MLLMs succeed and fail when applied to data visualization.
Focus Directions Make Your Language Models Pay More Attention to Relevant Contexts
Mar 30, 2025Abstract:Long-context large language models (LLMs) are prone to be distracted by irrelevant contexts. The reason for distraction remains poorly understood. In this paper, we first identify the contextual heads, a special group of attention heads that control the overall attention of the LLM. Then, we demonstrate that distraction arises when contextual heads fail to allocate sufficient attention to relevant contexts and can be mitigated by increasing attention to these contexts. We further identify focus directions, located at the key and query activations of these heads, which enable them to allocate more attention to relevant contexts without explicitly specifying which context is relevant. We comprehensively evaluate the effect of focus direction on various long-context tasks and find out focus directions could help to mitigate the poor task alignment of the long-context LLMs. We believe our findings could promote further research on long-context LLM alignment.
Melanoma Detection with Uncertainty Quantification
Nov 15, 2024


Abstract:Early detection of melanoma is crucial for improving survival rates. Current detection tools often utilize data-driven machine learning methods but often overlook the full integration of multiple datasets. We combine publicly available datasets to enhance data diversity, allowing numerous experiments to train and evaluate various classifiers. We then calibrate them to minimize misdiagnoses by incorporating uncertainty quantification. Our experiments on benchmark datasets show accuracies of up to 93.2% before and 97.8% after applying uncertainty-based rejection, leading to a reduction in misdiagnoses by over 40.5%. Our code and data are publicly available, and a web-based interface for quick melanoma detection of user-supplied images is also provided.
Boostlet.js: Image processing plugins for the web via JavaScript injection
May 13, 2024
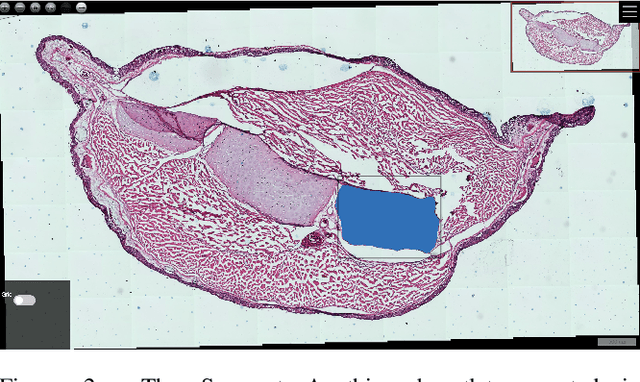
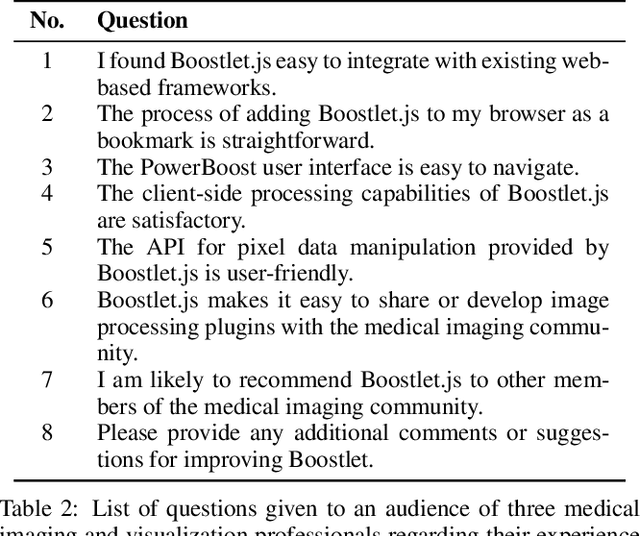
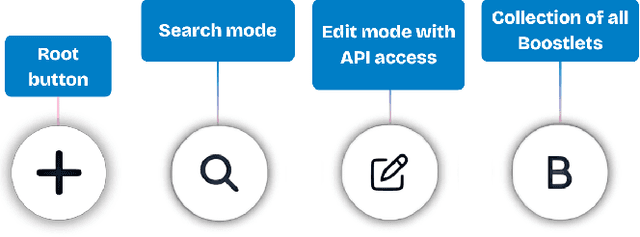
Abstract:Can web-based image processing and visualization tools easily integrate into existing websites without significant time and effort? Our Boostlet.js library addresses this challenge by providing an open-source, JavaScript-based web framework to enable additional image processing functionalities. Boostlet examples include kernel filtering, image captioning, data visualization, segmentation, and web-optimized machine-learning models. To achieve this, Boostlet.js uses a browser bookmark to inject a user-friendly plugin selection tool called PowerBoost into any host website. Boostlet also provides on-site access to a standard API independent of any visualization framework for pixel data and scene manipulation. Web-based Boostlets provide a modular architecture and client-side processing capabilities to apply advanced image-processing techniques using consumer-level hardware. The code is open-source and available.
Web-based Melanoma Detection
Mar 22, 2024


Abstract:Melanoma is the most aggressive form of skin cancer, and early detection can significantly increase survival rates and prevent cancer spread. However, developing reliable automated detection techniques is difficult due to the lack of standardized datasets and evaluation methods. This study introduces a unified melanoma classification approach that supports 54 combinations of 11 datasets and 24 state-of-the-art deep learning architectures. It enables a fair comparison of 1,296 experiments and results in a lightweight model deployable to the web-based MeshNet architecture named Mela-D. This approach can run up to 33x faster by reducing parameters 24x to yield an analogous 88.8\% accuracy comparable with ResNet50 on previously unseen images. This allows efficient and accurate melanoma detection in real-world settings that can run on consumer-level hardware.
Lesion Search with Self-supervised Learning
Nov 18, 2023


Abstract:Content-based image retrieval (CBIR) with self-supervised learning (SSL) accelerates clinicians' interpretation of similar images without manual annotations. We develop a CBIR from the contrastive learning SimCLR and incorporate a generalized-mean (GeM) pooling followed by L2 normalization to classify lesion types and retrieve similar images before clinicians' analysis. Results have shown improved performance. We additionally build an open-source application for image analysis and retrieval. The application is easy to integrate, relieving manual efforts and suggesting the potential to support clinicians' everyday activities.
MedShapeNet -- A Large-Scale Dataset of 3D Medical Shapes for Computer Vision
Sep 12, 2023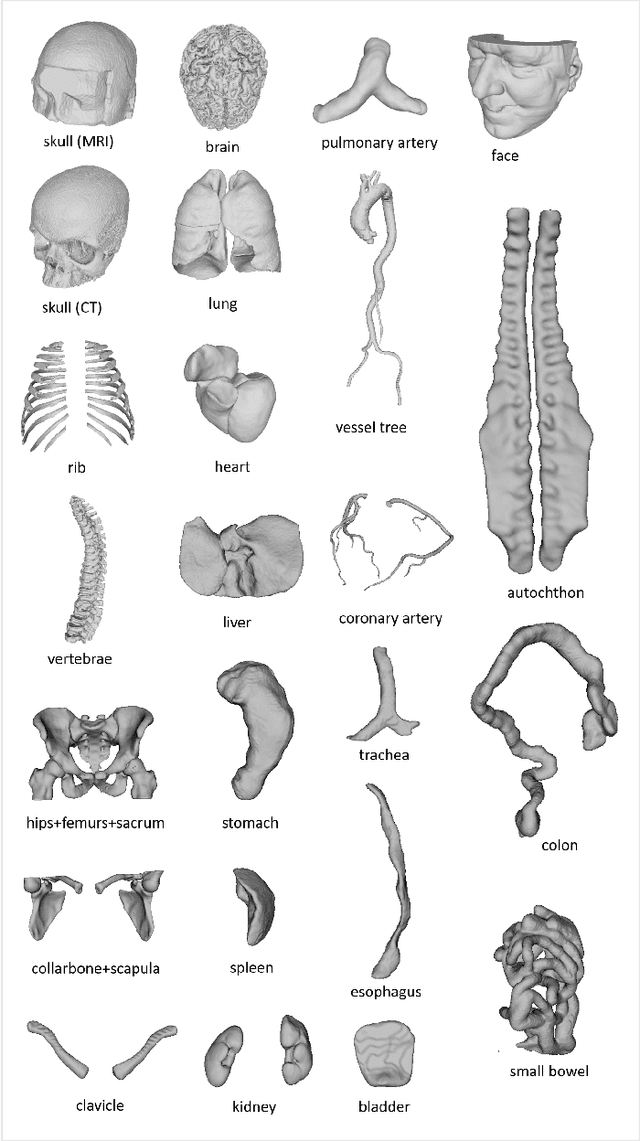

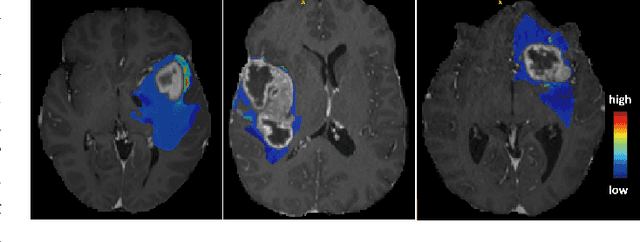
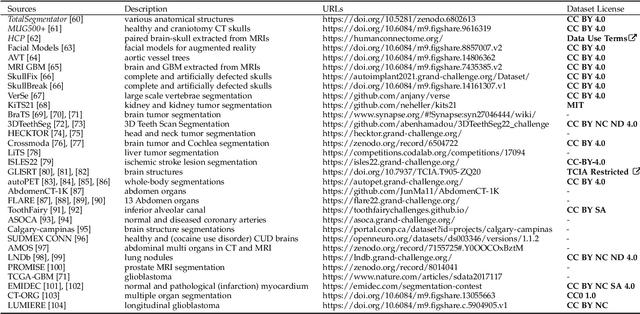
Abstract:We present MedShapeNet, a large collection of anatomical shapes (e.g., bones, organs, vessels) and 3D surgical instrument models. Prior to the deep learning era, the broad application of statistical shape models (SSMs) in medical image analysis is evidence that shapes have been commonly used to describe medical data. Nowadays, however, state-of-the-art (SOTA) deep learning algorithms in medical imaging are predominantly voxel-based. In computer vision, on the contrary, shapes (including, voxel occupancy grids, meshes, point clouds and implicit surface models) are preferred data representations in 3D, as seen from the numerous shape-related publications in premier vision conferences, such as the IEEE/CVF Conference on Computer Vision and Pattern Recognition (CVPR), as well as the increasing popularity of ShapeNet (about 51,300 models) and Princeton ModelNet (127,915 models) in computer vision research. MedShapeNet is created as an alternative to these commonly used shape benchmarks to facilitate the translation of data-driven vision algorithms to medical applications, and it extends the opportunities to adapt SOTA vision algorithms to solve critical medical problems. Besides, the majority of the medical shapes in MedShapeNet are modeled directly on the imaging data of real patients, and therefore it complements well existing shape benchmarks comprising of computer-aided design (CAD) models. MedShapeNet currently includes more than 100,000 medical shapes, and provides annotations in the form of paired data. It is therefore also a freely available repository of 3D models for extended reality (virtual reality - VR, augmented reality - AR, mixed reality - MR) and medical 3D printing. This white paper describes in detail the motivations behind MedShapeNet, the shape acquisition procedures, the use cases, as well as the usage of the online shape search portal: https://medshapenet.ikim.nrw/
SlicerTMS: Interactive Real-time Visualization of Transcranial Magnetic Stimulation using Augmented Reality and Deep Learning
May 23, 2023


Abstract:Transcranial magnetic stimulation (TMS) is a non-invasive neuromodulation approach that effectively treats various brain disorders. One of the critical factors in the success of TMS treatment is accurate coil placement, which can be challenging, especially when targeting specific brain areas for individual patients. Calculating the optimal coil placement and the resulting electric field on the brain surface can be expensive and time-consuming. We introduce SlicerTMS, a simulation method that allows the real-time visualization of the TMS electromagnetic field within the medical imaging platform 3D Slicer. Our software leverages a 3D deep neural network, supports cloud-based inference, and includes augmented reality visualization using WebXR. We evaluate the performance of SlicerTMS with multiple hardware configurations and compare it against the existing TMS visualization application SimNIBS. All our code, data, and experiments are openly available: \url{https://github.com/lorifranke/SlicerTMS}
AutoDOViz: Human-Centered Automation for Decision Optimization
Feb 19, 2023Abstract:We present AutoDOViz, an interactive user interface for automated decision optimization (AutoDO) using reinforcement learning (RL). Decision optimization (DO) has classically being practiced by dedicated DO researchers where experts need to spend long periods of time fine tuning a solution through trial-and-error. AutoML pipeline search has sought to make it easier for a data scientist to find the best machine learning pipeline by leveraging automation to search and tune the solution. More recently, these advances have been applied to the domain of AutoDO, with a similar goal to find the best reinforcement learning pipeline through algorithm selection and parameter tuning. However, Decision Optimization requires significantly more complex problem specification when compared to an ML problem. AutoDOViz seeks to lower the barrier of entry for data scientists in problem specification for reinforcement learning problems, leverage the benefits of AutoDO algorithms for RL pipeline search and finally, create visualizations and policy insights in order to facilitate the typical interactive nature when communicating problem formulation and solution proposals between DO experts and domain experts. In this paper, we report our findings from semi-structured expert interviews with DO practitioners as well as business consultants, leading to design requirements for human-centered automation for DO with RL. We evaluate a system implementation with data scientists and find that they are significantly more open to engage in DO after using our proposed solution. AutoDOViz further increases trust in RL agent models and makes the automated training and evaluation process more comprehensible. As shown for other automation in ML tasks, we also conclude automation of RL for DO can benefit from user and vice-versa when the interface promotes human-in-the-loop.
 Add to Chrome
 Add to Firefox
 Add to Edge