FiberStars: Visual Comparison of Diffusion Tractography Data between Multiple Subjects
Paper and Code
May 16, 2020


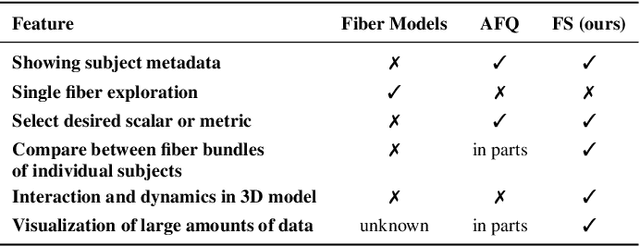
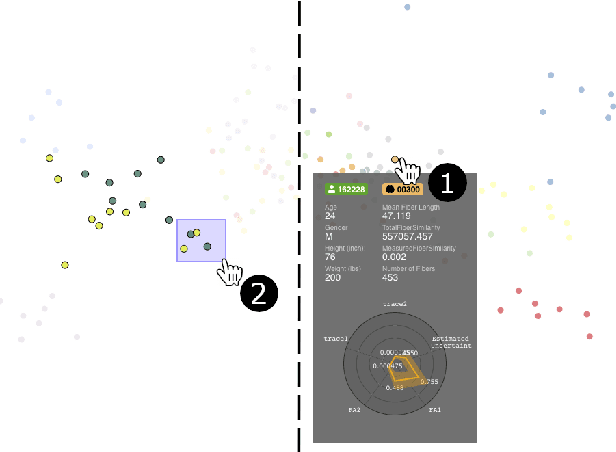
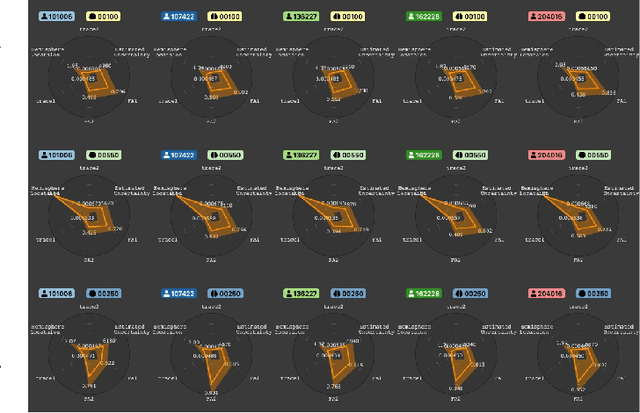
Tractography from high-dimensional diffusion magnetic resonance imaging (dMRI) data allows brain's structural connectivity analysis. Recent dMRI studies aim to compare connectivity patterns across thousands of subjects to understand subtle abnormalities in brain's white matter connectivity across disease populations. Besides connectivity differences, researchers are also interested in investigating distributions of biologically sensitive dMRI derived metrics across subject groups. Existing software products focus solely on the anatomy or are not intuitive and restrict the comparison of multiple subjects. In this paper, we present the design and implementation of FiberStars, a visual analysis tool for tractography data that allows the interactive and scalable visualization of brain fiber clusters in 2D and 3D. With FiberStars, researchers can analyze and compare multiple subjects in large collections of brain fibers. To evaluate the usability of our software, we performed a quantitative user study. We asked non-experts to find patterns in a large tractography dataset with either FiberStars or AFQ-Browser, an existing dMRI exploration tool. Our results show that participants using FiberStars can navigate extensive collections of tractography faster and more accurately. We discuss our findings and provide an analysis of the requirements for comparative visualizations of tractography data. All our research, software, and results are available openly.
 Add to Chrome
 Add to Firefox
 Add to Edge