Ernest Fraenkel
Massachusetts Institute of Technology, Cambridge, MA, USA
CHAMMI-75: pre-training multi-channel models with heterogeneous microscopy images
Dec 23, 2025Abstract:Quantifying cell morphology using images and machine learning has proven to be a powerful tool to study the response of cells to treatments. However, models used to quantify cellular morphology are typically trained with a single microscopy imaging type. This results in specialized models that cannot be reused across biological studies because the technical specifications do not match (e.g., different number of channels), or because the target experimental conditions are out of distribution. Here, we present CHAMMI-75, an open access dataset of heterogeneous, multi-channel microscopy images from 75 diverse biological studies. We curated this resource from publicly available sources to investigate cellular morphology models that are channel-adaptive and can process any microscopy image type. Our experiments show that training with CHAMMI-75 can improve performance in multi-channel bioimaging tasks primarily because of its high diversity in microscopy modalities. This work paves the way to create the next generation of cellular morphology models for biological studies.
Biologically Disentangled Multi-Omic Modeling Reveals Mechanistic Insights into Pan-Cancer Immunotherapy Resistance
Aug 26, 2025Abstract:Immune checkpoint inhibitors (ICIs) have transformed cancer treatment, yet patient responses remain highly variable, and the biological mechanisms underlying resistance are poorly understood. While machine learning models hold promise for predicting responses to ICIs, most existing methods lack interpretability and do not effectively leverage the biological structure inherent to multi-omics data. Here, we introduce the Biologically Disentangled Variational Autoencoder (BDVAE), a deep generative model that integrates transcriptomic and genomic data through modality- and pathway-specific encoders. Unlike existing rigid, pathway-informed models, BDVAE employs a modular encoder architecture combined with variational inference to learn biologically meaningful latent features associated with immune, genomic, and metabolic processes. Applied to a pan-cancer cohort of 366 patients across four cancer types treated with ICIs, BDVAE accurately predicts treatment response (AUC-ROC = 0.94 on unseen test data) and uncovers critical resistance mechanisms, including immune suppression, metabolic shifts, and neuronal signaling. Importantly, BDVAE reveals that resistance spans a continuous biological spectrum rather than strictly binary states, reflecting gradations of tumor dysfunction. Several latent features correlate with survival outcomes and known clinical subtypes, demonstrating BDVAE's capability to generate interpretable, clinically relevant insights. These findings underscore the value of biologically structured machine learning in elucidating complex resistance patterns and guiding precision immunotherapy strategies.
Remote Inference of Cognitive Scores in ALS Patients Using a Picture Description
Sep 13, 2023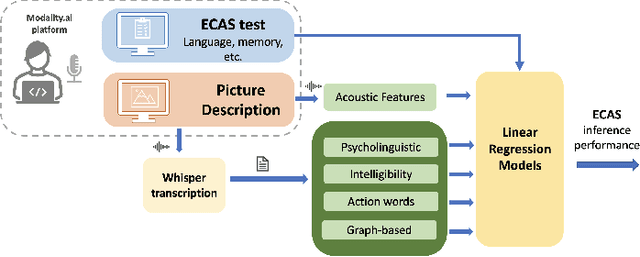
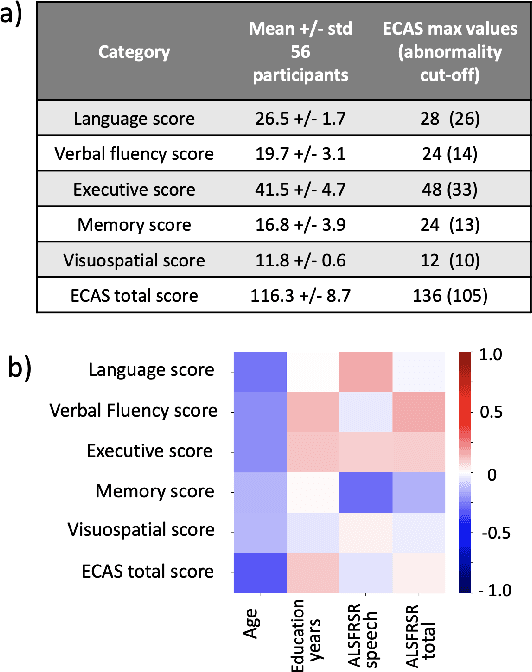
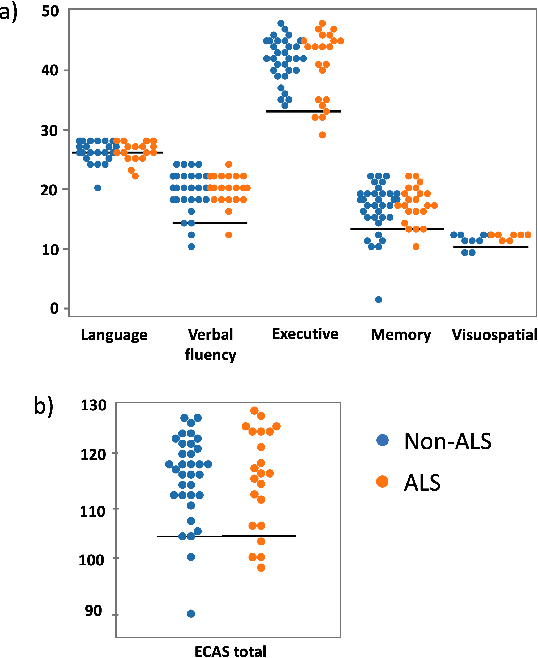
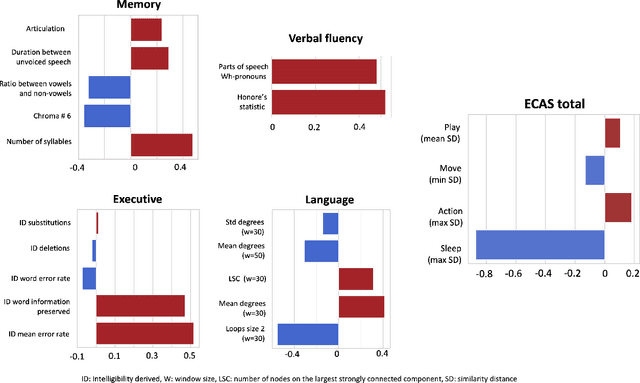
Abstract:Amyotrophic lateral sclerosis is a fatal disease that not only affects movement, speech, and breath but also cognition. Recent studies have focused on the use of language analysis techniques to detect ALS and infer scales for monitoring functional progression. In this paper, we focused on another important aspect, cognitive impairment, which affects 35-50% of the ALS population. In an effort to reach the ALS population, which frequently exhibits mobility limitations, we implemented the digital version of the Edinburgh Cognitive and Behavioral ALS Screen (ECAS) test for the first time. This test which is designed to measure cognitive impairment was remotely performed by 56 participants from the EverythingALS Speech Study. As part of the study, participants (ALS and non-ALS) were asked to describe weekly one picture from a pool of many pictures with complex scenes displayed on their computer at home. We analyze the descriptions performed within +/- 60 days from the day the ECAS test was administered and extract different types of linguistic and acoustic features. We input those features into linear regression models to infer 5 ECAS sub-scores and the total score. Speech samples from the picture description are reliable enough to predict the ECAS subs-scores, achieving statistically significant Spearman correlation values between 0.32 and 0.51 for the model's performance using 10-fold cross-validation.
Efficiently predicting high resolution mass spectra with graph neural networks
Jan 26, 2023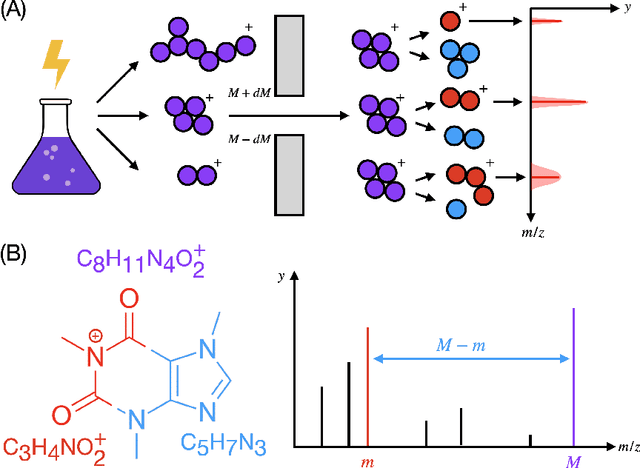

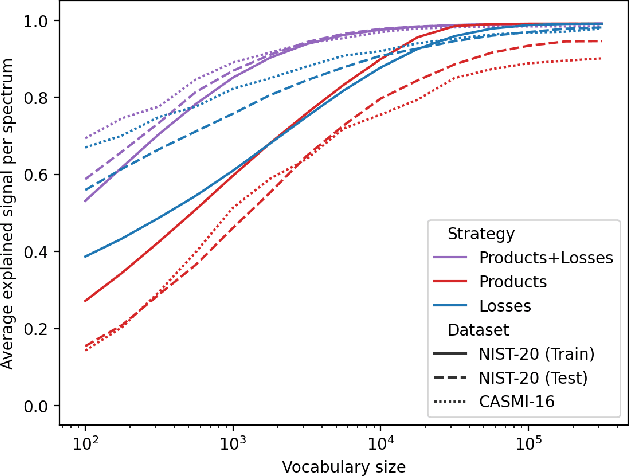

Abstract:Identifying a small molecule from its mass spectrum is the primary open problem in computational metabolomics. This is typically cast as information retrieval: an unknown spectrum is matched against spectra predicted computationally from a large database of chemical structures. However, current approaches to spectrum prediction model the output space in ways that force a tradeoff between capturing high resolution mass information and tractable learning. We resolve this tradeoff by casting spectrum prediction as a mapping from an input molecular graph to a probability distribution over molecular formulas. We discover that a large corpus of mass spectra can be closely approximated using a fixed vocabulary constituting only 2% of all observed formulas. This enables efficient spectrum prediction using an architecture similar to graph classification - GrAFF-MS - achieving significantly lower prediction error and orders-of-magnitude faster runtime than state-of-the-art methods.
Adaptive Bias Correction for Improved Subseasonal Forecasting
Sep 21, 2022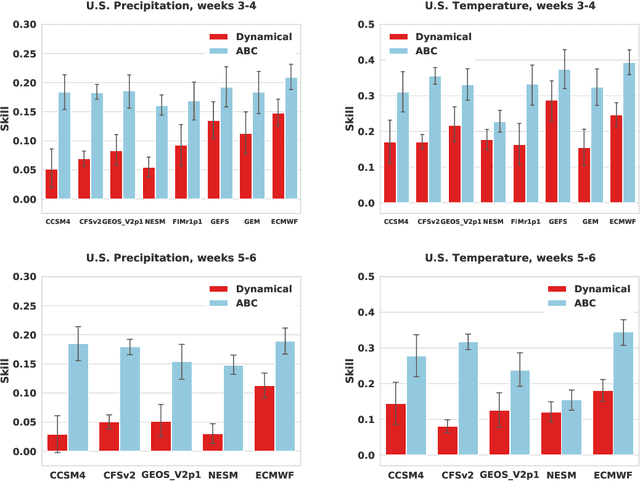
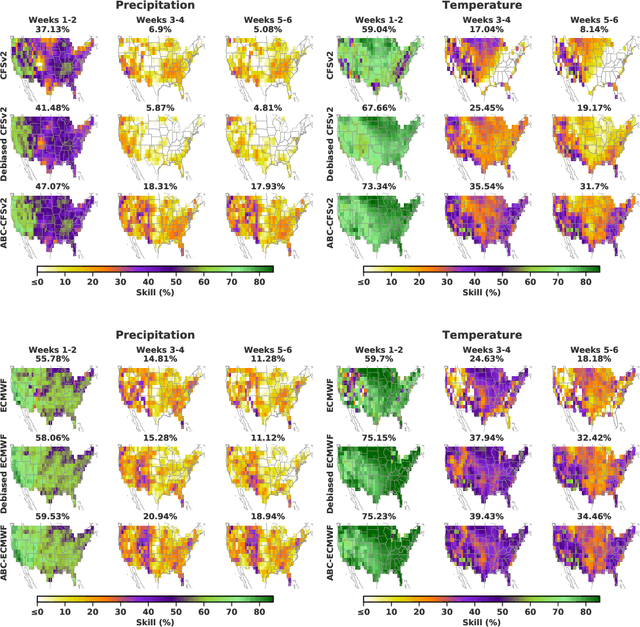
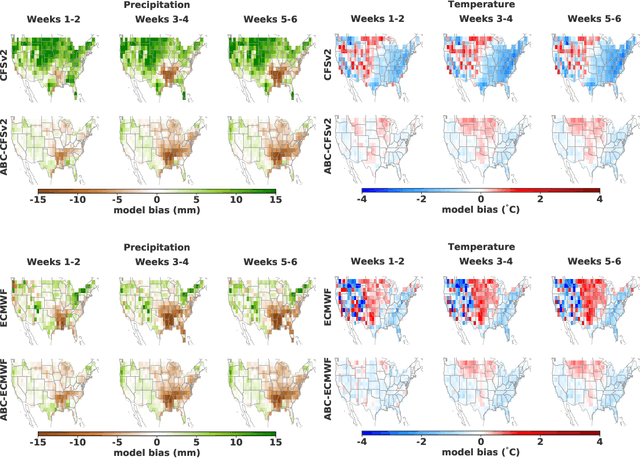
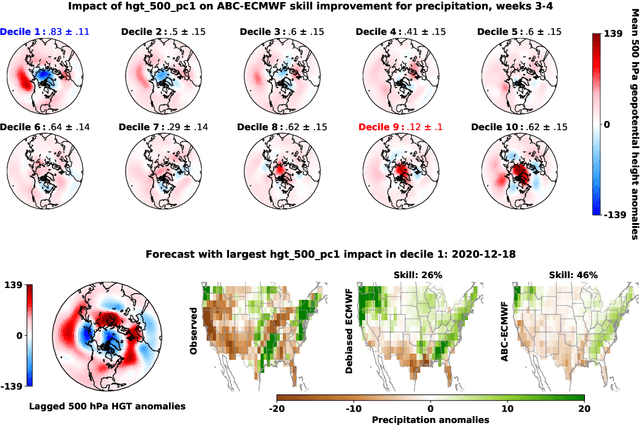
Abstract:Subseasonal forecasting $\unicode{x2013}$ predicting temperature and precipitation 2 to 6 weeks $\unicode{x2013}$ ahead is critical for effective water allocation, wildfire management, and drought and flood mitigation. Recent international research efforts have advanced the subseasonal capabilities of operational dynamical models, yet temperature and precipitation prediction skills remains poor, partly due to stubborn errors in representing atmospheric dynamics and physics inside dynamical models. To counter these errors, we introduce an adaptive bias correction (ABC) method that combines state-of-the-art dynamical forecasts with observations using machine learning. When applied to the leading subseasonal model from the European Centre for Medium-Range Weather Forecasts (ECMWF), ABC improves temperature forecasting skill by 60-90% and precipitation forecasting skill by 40-69% in the contiguous U.S. We couple these performance improvements with a practical workflow, based on Cohort Shapley, for explaining ABC skill gains and identifying higher-skill windows of opportunity based on specific climate conditions.
Learned Benchmarks for Subseasonal Forecasting
Sep 21, 2021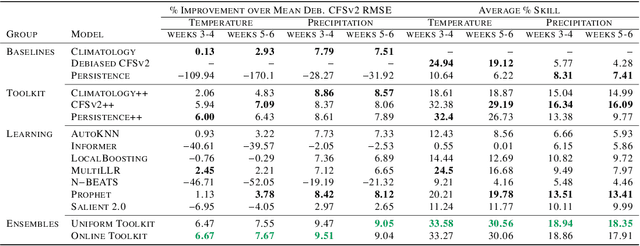
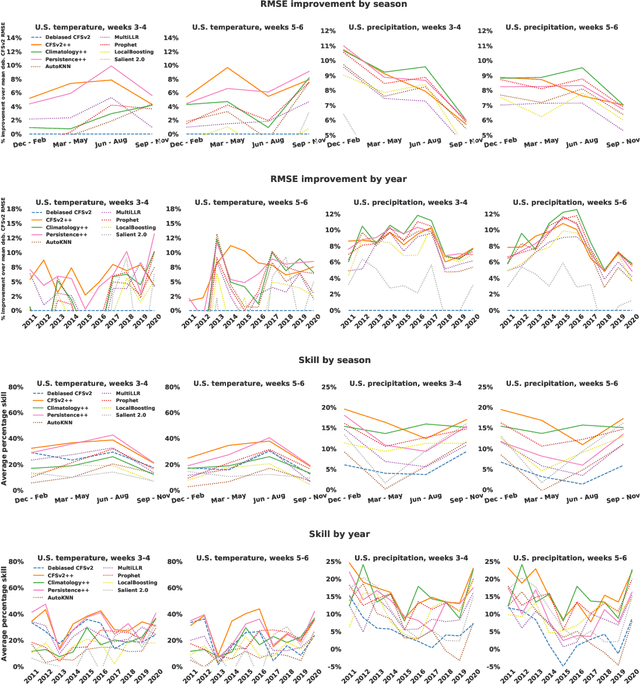
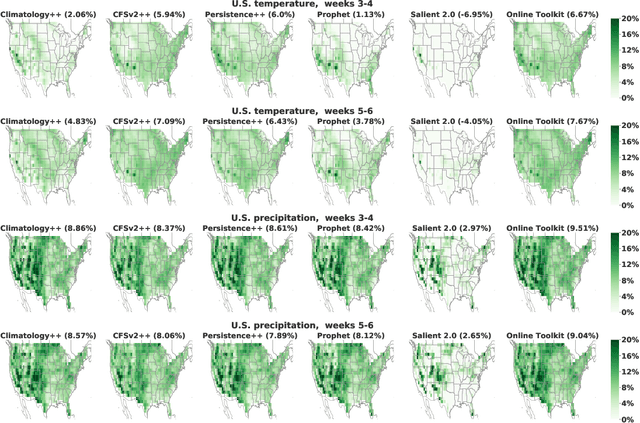

Abstract:We develop a subseasonal forecasting toolkit of simple learned benchmark models that outperform both operational practice and state-of-the-art machine learning and deep learning methods. Our new models include (a) Climatology++, an adaptive alternative to climatology that, for precipitation, is 9% more accurate and 250% more skillful than the United States operational Climate Forecasting System (CFSv2); (b) CFSv2++, a learned CFSv2 correction that improves temperature and precipitation accuracy by 7-8% and skill by 50-275%; and (c) Persistence++, an augmented persistence model that combines CFSv2 forecasts with lagged measurements to improve temperature and precipitation accuracy by 6-9% and skill by 40-130%. Across the contiguous U.S., our Climatology++, CFSv2++, and Persistence++ toolkit consistently outperforms standard meteorological baselines, state-of-the-art machine and deep learning methods, and the European Centre for Medium-Range Weather Forecasts ensemble. Overall, we find that augmenting traditional forecasting approaches with learned enhancements yields an effective and computationally inexpensive strategy for building the next generation of subseasonal forecasting benchmarks.
Investigating the Utility of Multimodal Conversational Technology and Audiovisual Analytic Measures for the Assessment and Monitoring of Amyotrophic Lateral Sclerosis at Scale
Apr 15, 2021
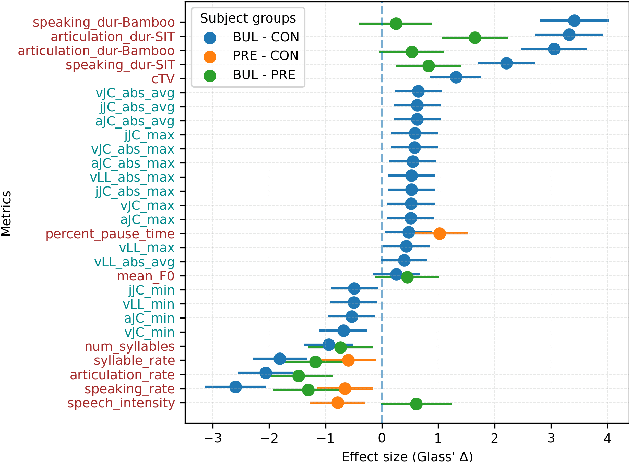
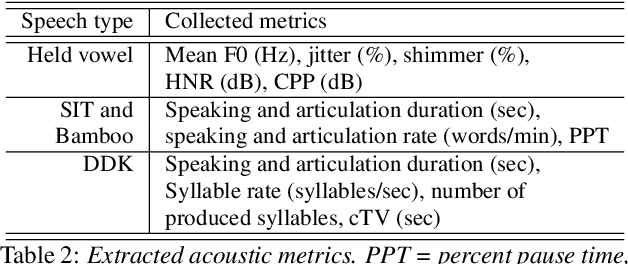

Abstract:We propose a cloud-based multimodal dialog platform for the remote assessment and monitoring of Amyotrophic Lateral Sclerosis (ALS) at scale. This paper presents our vision, technology setup, and an initial investigation of the efficacy of the various acoustic and visual speech metrics automatically extracted by the platform. 82 healthy controls and 54 people with ALS (pALS) were instructed to interact with the platform and completed a battery of speaking tasks designed to probe the acoustic, articulatory, phonatory, and respiratory aspects of their speech. We find that multiple acoustic (rate, duration, voicing) and visual (higher order statistics of the jaw and lip) speech metrics show statistically significant differences between controls, bulbar symptomatic and bulbar pre-symptomatic patients. We report on the sensitivity and specificity of these metrics using five-fold cross-validation. We further conducted a LASSO-LARS regression analysis to uncover the relative contributions of various acoustic and visual features in predicting the severity of patients' ALS (as measured by their self-reported ALSFRS-R scores). Our results provide encouraging evidence of the utility of automatically extracted audiovisual analytics for scalable remote patient assessment and monitoring in ALS.
Graph-Sparse Logistic Regression
Dec 15, 2017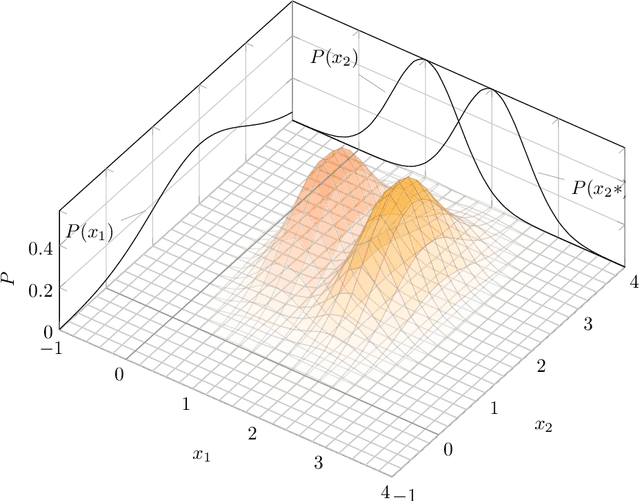
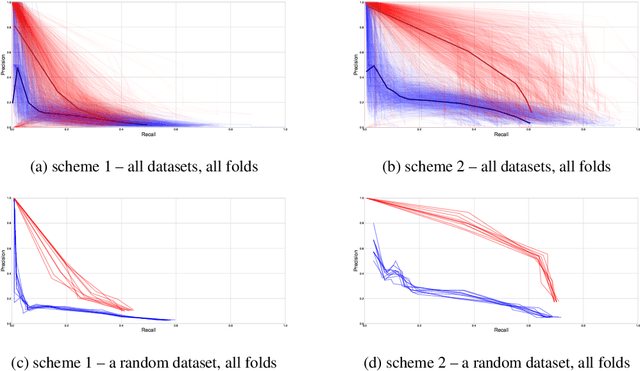
Abstract:We introduce Graph-Sparse Logistic Regression, a new algorithm for classification for the case in which the support should be sparse but connected on a graph. We val- idate this algorithm against synthetic data and benchmark it against L1-regularized Logistic Regression. We then explore our technique in the bioinformatics context of proteomics data on the interactome graph. We make all our experimental code public and provide GSLR as an open source package.
Unsupervised learning of transcriptional regulatory networks via latent tree graphical models
Sep 20, 2016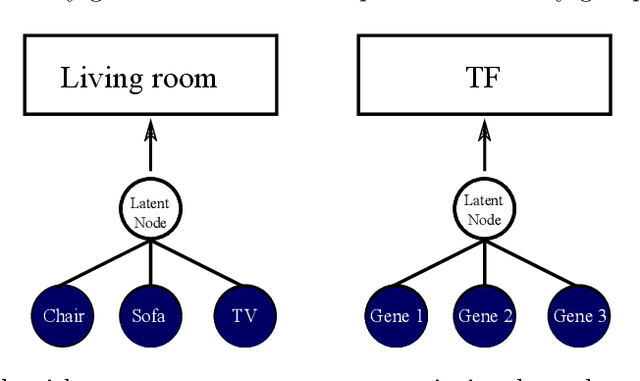

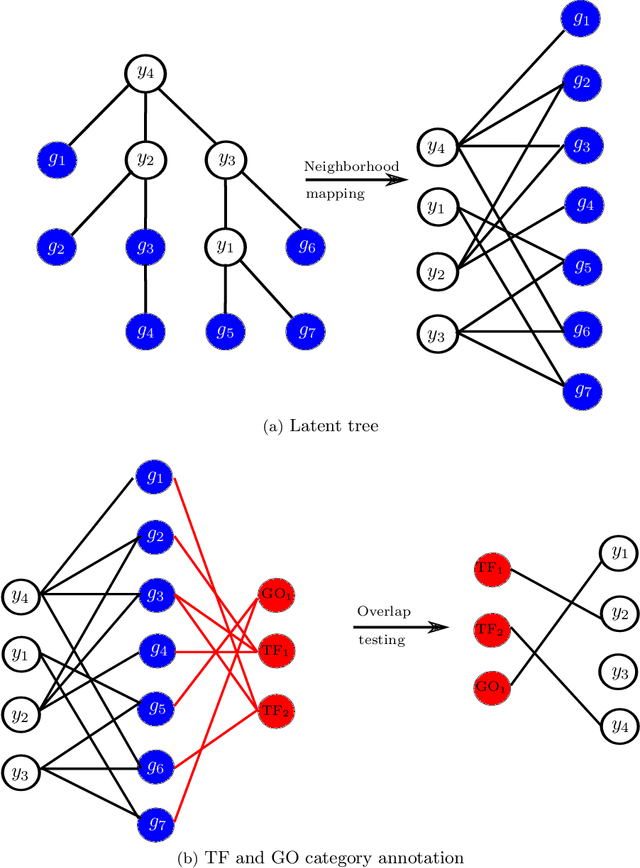
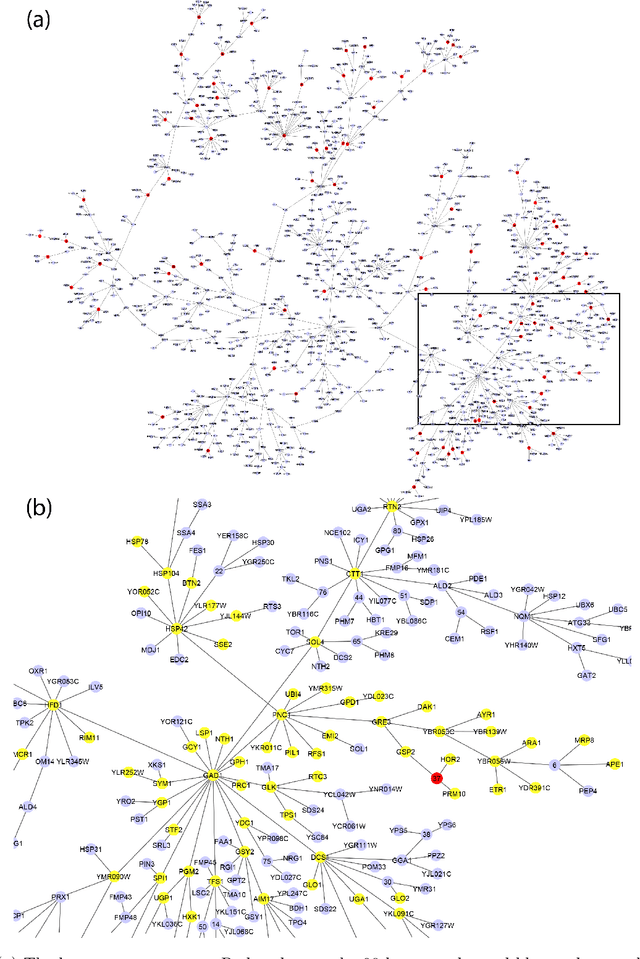
Abstract:Gene expression is a readily-observed quantification of transcriptional activity and cellular state that enables the recovery of the relationships between regulators and their target genes. Reconstructing transcriptional regulatory networks from gene expression data is a problem that has attracted much attention, but previous work often makes the simplifying (but unrealistic) assumption that regulator activity is represented by mRNA levels. We use a latent tree graphical model to analyze gene expression without relying on transcription factor expression as a proxy for regulator activity. The latent tree model is a type of Markov random field that includes both observed gene variables and latent (hidden) variables, which factorize on a Markov tree. Through efficient unsupervised learning approaches, we determine which groups of genes are co-regulated by hidden regulators and the activity levels of those regulators. Post-processing annotates many of these discovered latent variables as specific transcription factors or groups of transcription factors. Other latent variables do not necessarily represent physical regulators but instead reveal hidden structure in the gene expression such as shared biological function. We apply the latent tree graphical model to a yeast stress response dataset. In addition to novel predictions, such as condition-specific binding of the transcription factor Msn4, our model recovers many known aspects of the yeast regulatory network. These include groups of co-regulated genes, condition-specific regulator activity, and combinatorial regulation among transcription factors. The latent tree graphical model is a general approach for analyzing gene expression data that requires no prior knowledge of which possible regulators exist, regulator activity, or where transcription factors physically bind.
Discovering Neuronal Cell Types and Their Gene Expression Profiles Using a Spatial Point Process Mixture Model
Jun 11, 2016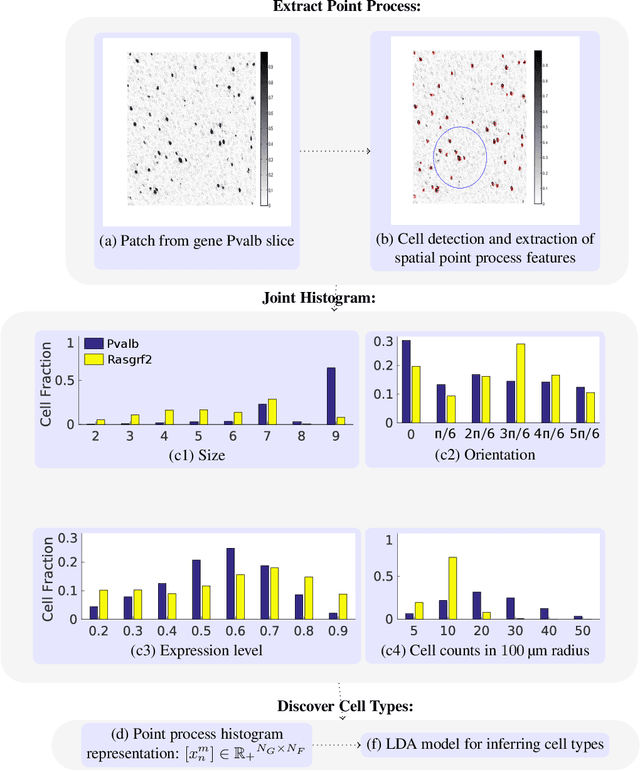

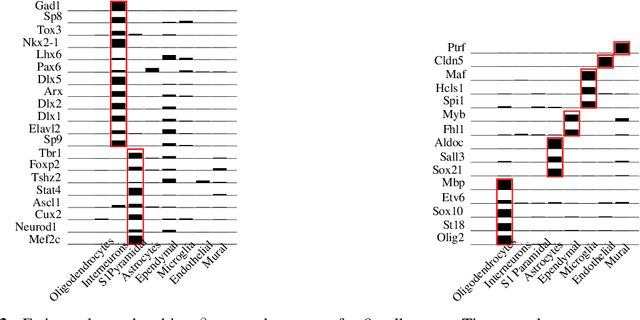

Abstract:Cataloging the neuronal cell types that comprise circuitry of individual brain regions is a major goal of modern neuroscience and the BRAIN initiative. Single-cell RNA sequencing can now be used to measure the gene expression profiles of individual neurons and to categorize neurons based on their gene expression profiles. While the single-cell techniques are extremely powerful and hold great promise, they are currently still labor intensive, have a high cost per cell, and, most importantly, do not provide information on spatial distribution of cell types in specific regions of the brain. We propose a complementary approach that uses computational methods to infer the cell types and their gene expression profiles through analysis of brain-wide single-cell resolution in situ hybridization (ISH) imagery contained in the Allen Brain Atlas (ABA). We measure the spatial distribution of neurons labeled in the ISH image for each gene and model it as a spatial point process mixture, whose mixture weights are given by the cell types which express that gene. By fitting a point process mixture model jointly to the ISH images, we infer both the spatial point process distribution for each cell type and their gene expression profile. We validate our predictions of cell type-specific gene expression profiles using single cell RNA sequencing data, recently published for the mouse somatosensory cortex. Jointly with the gene expression profiles, cell features such as cell size, orientation, intensity and local density level are inferred per cell type.
 Add to Chrome
 Add to Firefox
 Add to Edge