Veit Hagenmeyer
Institute for Automation and Applied Informatics, Karlsruhe Institute of Technology
Explainable time-series forecasting with sampling-free SHAP for Transformers
Dec 23, 2025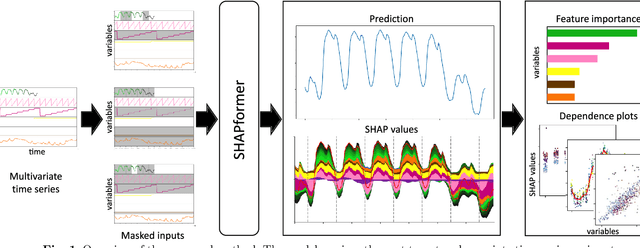

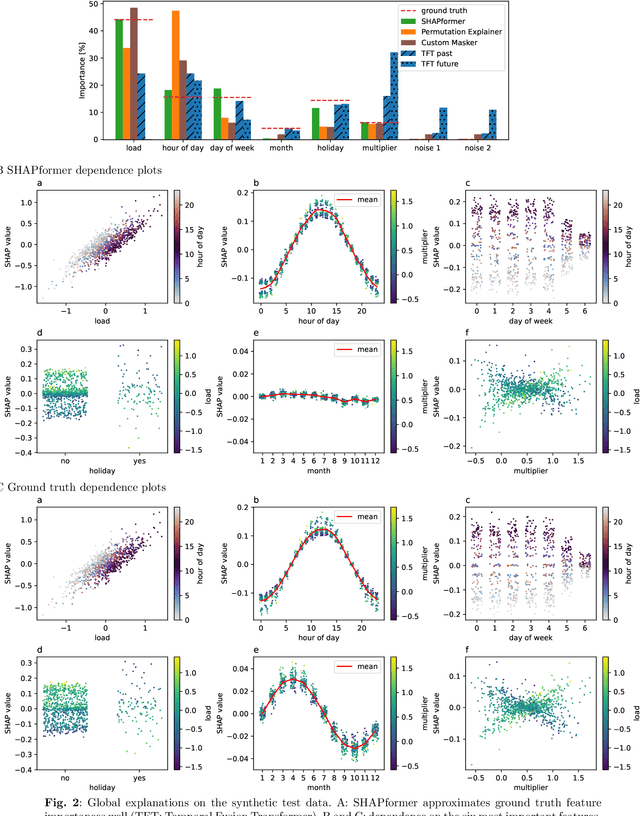
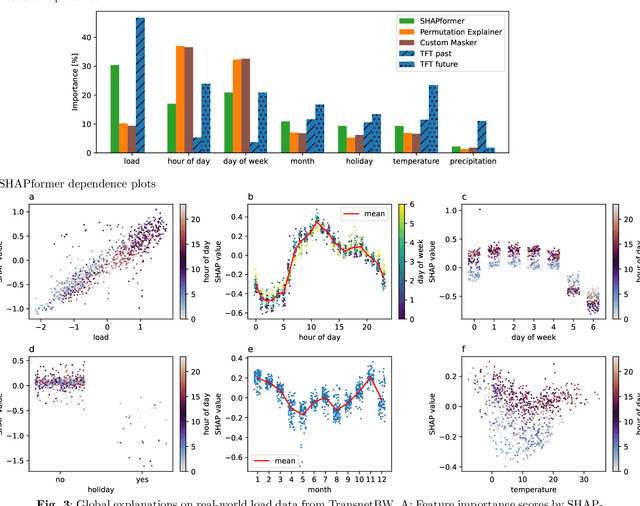
Abstract:Time-series forecasts are essential for planning and decision-making in many domains. Explainability is key to building user trust and meeting transparency requirements. Shapley Additive Explanations (SHAP) is a popular explainable AI framework, but it lacks efficient implementations for time series and often assumes feature independence when sampling counterfactuals. We introduce SHAPformer, an accurate, fast and sampling-free explainable time-series forecasting model based on the Transformer architecture. It leverages attention manipulation to make predictions based on feature subsets. SHAPformer generates explanations in under one second, several orders of magnitude faster than the SHAP Permutation Explainer. On synthetic data with ground truth explanations, SHAPformer provides explanations that are true to the data. Applied to real-world electrical load data, it achieves competitive predictive performance and delivers meaningful local and global insights, such as identifying the past load as the key predictor and revealing a distinct model behavior during the Christmas period.
A Global Analysis of Cyber Threats to the Energy Sector: "Currents of Conflict" from a Geopolitical Perspective
Sep 26, 2025


Abstract:The escalating frequency and sophistication of cyber threats increased the need for their comprehensive understanding. This paper explores the intersection of geopolitical dynamics, cyber threat intelligence analysis, and advanced detection technologies, with a focus on the energy domain. We leverage generative artificial intelligence to extract and structure information from raw cyber threat descriptions, enabling enhanced analysis. By conducting a geopolitical comparison of threat actor origins and target regions across multiple databases, we provide insights into trends within the general threat landscape. Additionally, we evaluate the effectiveness of cybersecurity tools -- with particular emphasis on learning-based techniques -- in detecting indicators of compromise for energy-targeted attacks. This analysis yields new insights, providing actionable information to researchers, policy makers, and cybersecurity professionals.
* THIS IS A POSTPRINT OF A PEER-REVIEWED ARTICLE, PLEASE CITE IT IF USING THIS WORK: Gustavo Sanchez, Ghada Elbez, and Veit Hagenmeyer. "A Global Analysis of Cyber Threats to the Energy Sector:"Currents of Conflict" from a geopolitical perspective." atp magazin 67.9 (2025): 56-66. https://doi.org/10.17560/atp.v67i9.2797
Decision-Focused Fine-Tuning of Time Series Foundation Models for Dispatchable Feeder Optimization
Mar 03, 2025Abstract:Time series foundation models provide a universal solution for generating forecasts to support optimization problems in energy systems. Those foundation models are typically trained in a prediction-focused manner to maximize forecast quality. In contrast, decision-focused learning directly improves the resulting value of the forecast in downstream optimization rather than merely maximizing forecasting quality. The practical integration of forecast values into forecasting models is challenging, particularly when addressing complex applications with diverse instances, such as buildings. This becomes even more complicated when instances possess specific characteristics that require instance-specific, tailored predictions to increase the forecast value. To tackle this challenge, we use decision-focused fine-tuning within time series foundation models to offer a scalable and efficient solution for decision-focused learning applied to the dispatchable feeder optimization problem. To obtain more robust predictions for scarce building data, we use Moirai as a state-of-the-art foundation model, which offers robust and generalized results with few-shot parameter-efficient fine-tuning. Comparing the decision-focused fine-tuned Moirai with a state-of-the-art classical prediction-focused fine-tuning Morai, we observe an improvement of 9.45% in average total daily costs.
AutoPQ: Automating Quantile estimation from Point forecasts in the context of sustainability
Nov 30, 2024
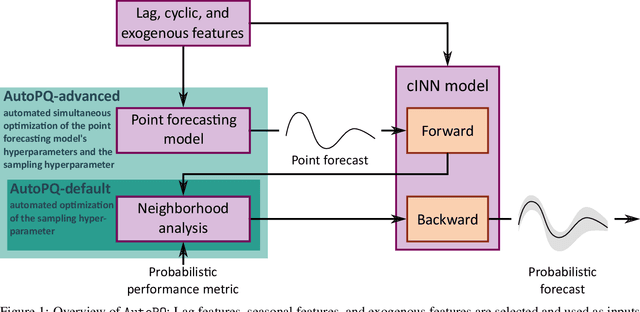

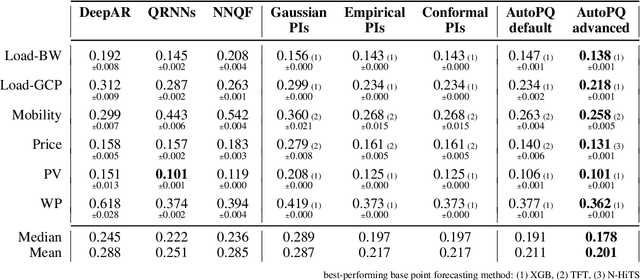
Abstract:Optimizing smart grid operations relies on critical decision-making informed by uncertainty quantification, making probabilistic forecasting a vital tool. Designing such forecasting models involves three key challenges: accurate and unbiased uncertainty quantification, workload reduction for data scientists during the design process, and limitation of the environmental impact of model training. In order to address these challenges, we introduce AutoPQ, a novel method designed to automate and optimize probabilistic forecasting for smart grid applications. AutoPQ enhances forecast uncertainty quantification by generating quantile forecasts from an existing point forecast by using a conditional Invertible Neural Network (cINN). AutoPQ also automates the selection of the underlying point forecasting method and the optimization of hyperparameters, ensuring that the best model and configuration is chosen for each application. For flexible adaptation to various performance needs and available computing power, AutoPQ comes with a default and an advanced configuration, making it suitable for a wide range of smart grid applications. Additionally, AutoPQ provides transparency regarding the electricity consumption required for performance improvements. We show that AutoPQ outperforms state-of-the-art probabilistic forecasting methods while effectively limiting computational effort and hence environmental impact. Additionally and in the context of sustainability, we quantify the electricity consumption required for performance improvements.
On autoregressive deep learning models for day-ahead wind power forecasting with irregular shutdowns due to redispatching
Nov 30, 2024


Abstract:Renewable energies and their operation are becoming increasingly vital for the stability of electrical power grids since conventional power plants are progressively being displaced, and their contribution to redispatch interventions is thereby diminishing. In order to consider renewable energies like Wind Power (WP) for such interventions as a substitute, day-ahead forecasts are necessary to communicate their availability for redispatch planning. In this context, automated and scalable forecasting models are required for the deployment to thousands of locally-distributed onshore WP turbines. Furthermore, the irregular interventions into the WP generation capabilities due to redispatch shutdowns pose challenges in the design and operation of WP forecasting models. Since state-of-the-art forecasting methods consider past WP generation values alongside day-ahead weather forecasts, redispatch shutdowns may impact the forecast. Therefore, the present paper highlights these challenges and analyzes state-of-the-art forecasting methods on data sets with both regular and irregular shutdowns. Specifically, we compare the forecasting accuracy of three autoregressive Deep Learning (DL) methods to methods based on WP curve modeling. Interestingly, the latter achieve lower forecasting errors, have fewer requirements for data cleaning during modeling and operation while being computationally more efficient, suggesting their advantages in practical applications.
Generating peak-aware pseudo-measurements for low-voltage feeders using metadata of distribution system operators
Sep 29, 2024


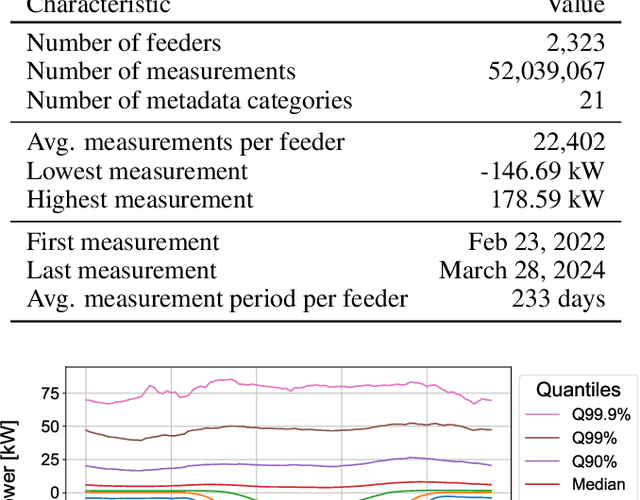
Abstract:Distribution system operators (DSOs) must cope with new challenges such as the reconstruction of distribution grids along climate neutrality pathways or the ability to manage and control consumption and generation in the grid. In order to meet the challenges, measurements within the distribution grid often form the basis for DSOs. Hence, it is an urgent problem that measurement devices are not installed in many low-voltage (LV) grids. In order to overcome this problem, we present an approach to estimate pseudo-measurements for non-measured LV feeders based on the metadata of the respective feeder using regression models. The feeder metadata comprise information about the number of grid connection points, the installed power of consumers and producers, and billing data in the downstream LV grid. Additionally, we use weather data, calendar data and timestamp information as model features. The existing measurements are used as model target. We extensively evaluate the estimated pseudo-measurements on a large real-world dataset with 2,323 LV feeders characterized by both consumption and feed-in. For this purpose, we introduce peak metrics inspired by the BigDEAL challenge for the peak magnitude, timing and shape for both consumption and feed-in. As regression models, we use XGBoost, a multilayer perceptron (MLP) and a linear regression (LR). We observe that XGBoost and MLP outperform the LR. Furthermore, the results show that the approach adapts to different weather, calendar and timestamp conditions and produces realistic load curves based on the feeder metadata. In the future, the approach can be adapted to other grid levels like substation transformers and can supplement research fields like load modeling, state estimation and LV load forecasting.
Transformer Training Strategies for Forecasting Multiple Load Time Series
Jun 19, 2023Abstract:Recent work uses Transformers for load forecasting, which are the state of the art for sequence modeling tasks in data-rich domains. In the smart grid of the future, accurate load forecasts must be provided on the level of individual clients of an energy supplier. While the total amount of electrical load data available to an energy supplier will increase with the ongoing smart meter rollout, the amount of data per client will always be limited. We test whether the Transformer benefits from a transfer learning strategy, where a global model is trained on the load time series data from multiple clients. We find that the global model is superior to two other training strategies commonly used in related work: multivariate models and local models. A comparison to linear models and multi-layer perceptrons shows that Transformers are effective for electrical load forecasting when they are trained with the right strategy.
ProbPNN: Enhancing Deep Probabilistic Forecasting with Statistical Information
Feb 06, 2023


Abstract:Probabilistic forecasts are essential for various downstream applications such as business development, traffic planning, and electrical grid balancing. Many of these probabilistic forecasts are performed on time series data that contain calendar-driven periodicities. However, existing probabilistic forecasting methods do not explicitly take these periodicities into account. Therefore, in the present paper, we introduce a deep learning-based method that considers these calendar-driven periodicities explicitly. The present paper, thus, has a twofold contribution: First, we apply statistical methods that use calendar-driven prior knowledge to create rolling statistics and combine them with neural networks to provide better probabilistic forecasts. Second, we benchmark ProbPNN with state-of-the-art benchmarks by comparing the achieved normalised continuous ranked probability score (nCRPS) and normalised Pinball Loss (nPL) on two data sets containing in total more than 1000 time series. The results of the benchmarks show that using statistical forecasting components improves the probabilistic forecast performance and that ProbPNN outperforms other deep learning forecasting methods whilst requiring less computation costs.
Creating Probabilistic Forecasts from Arbitrary Deterministic Forecasts using Conditional Invertible Neural Networks
Feb 03, 2023


Abstract:In various applications, probabilistic forecasts are required to quantify the inherent uncertainty associated with the forecast. However, numerous modern forecasting methods are still designed to create deterministic forecasts. Transforming these deterministic forecasts into probabilistic forecasts is often challenging and based on numerous assumptions that may not hold in real-world situations. Therefore, the present article proposes a novel approach for creating probabilistic forecasts from arbitrary deterministic forecasts. In order to implement this approach, we use a conditional Invertible Neural Network (cINN). More specifically, we apply a cINN to learn the underlying distribution of the data and then combine the uncertainty from this distribution with an arbitrary deterministic forecast to generate accurate probabilistic forecasts. Our approach enables the simple creation of probabilistic forecasts without complicated statistical loss functions or further assumptions. Besides showing the mathematical validity of our approach, we empirically show that our approach noticeably outperforms traditional methods for including uncertainty in deterministic forecasts and generally outperforms state-of-the-art probabilistic forecasting benchmarks.
AutoPV: Automated photovoltaic forecasts with limited information using an ensemble of pre-trained models
Dec 13, 2022


Abstract:Accurate PhotoVoltaic (PV) power generation forecasting is vital for the efficient operation of Smart Grids. The automated design of such accurate forecasting models for individual PV plants includes two challenges: First, information about the PV mounting configuration (i.e. inclination and azimuth angles) is often missing. Second, for new PV plants, the amount of historical data available to train a forecasting model is limited (cold-start problem). We address these two challenges by proposing a new method for day-ahead PV power generation forecasts called AutoPV. AutoPV is a weighted ensemble of forecasting models that represent different PV mounting configurations. This representation is achieved by pre-training each forecasting model on a separate PV plant and by scaling the model's output with the peak power rating of the corresponding PV plant. To tackle the cold-start problem, we initially weight each forecasting model in the ensemble equally. To tackle the problem of missing information about the PV mounting configuration, we use new data that become available during operation to adapt the ensemble weights to minimize the forecasting error. AutoPV is advantageous as the unknown PV mounting configuration is implicitly reflected in the ensemble weights, and only the PV plant's peak power rating is required to re-scale the ensemble's output. AutoPV also allows to represent PV plants with panels distributed on different roofs with varying alignments, as these mounting configurations can be reflected proportionally in the weighting. Additionally, the required computing memory is decoupled when scaling AutoPV to hundreds of PV plants, which is beneficial in Smart Grids with limited computing capabilities. For a real-world data set with 11 PV plants, the accuracy of AutoPV is comparable to a model trained on two years of data and outperforms an incrementally trained model.
 Add to Chrome
 Add to Firefox
 Add to Edge