Clayton Miller
Recommender systems and reinforcement learning for building control and occupant interaction: A text-mining driven review of scientific literature
Nov 13, 2024

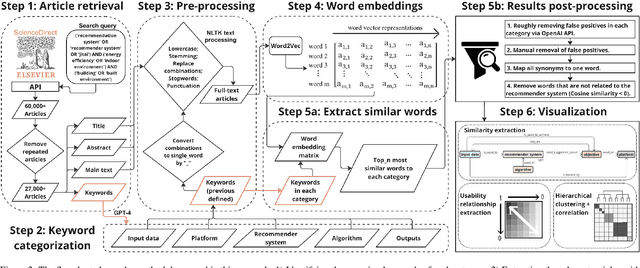
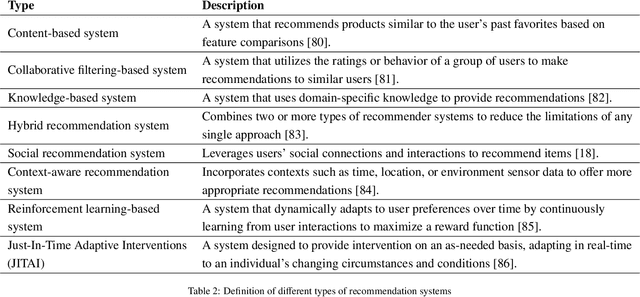
Abstract:The indoor environment greatly affects health and well-being; enhancing health and reducing energy use in these settings is a key research focus. With advancing Information and Communication Technology (ICT), recommendation systems and reinforcement learning have emerged as promising methods to induce behavioral changes that improve indoor environments and building energy efficiency. This study employs text-mining and Natural Language Processing (NLP) to examine these approaches in building control and occupant interaction. Analyzing approximately 27,000 articles from the ScienceDirect database, we found extensive use of recommendation systems and reinforcement learning for space optimization, location recommendations, and personalized control suggestions. Despite broad applications, their use in optimizing indoor environments and energy efficiency is limited. Traditional recommendation algorithms are commonly used, but optimizing indoor conditions and energy efficiency often requires advanced machine learning techniques like reinforcement and deep learning. This review highlights the potential for expanding recommender systems and reinforcement learning applications in buildings and indoor environments. Areas for innovation include predictive maintenance, building-related product recommendations, and optimizing environments for specific needs like sleep and productivity enhancements based on user feedback.
Creating synthetic energy meter data using conditional diffusion and building metadata
Mar 31, 2024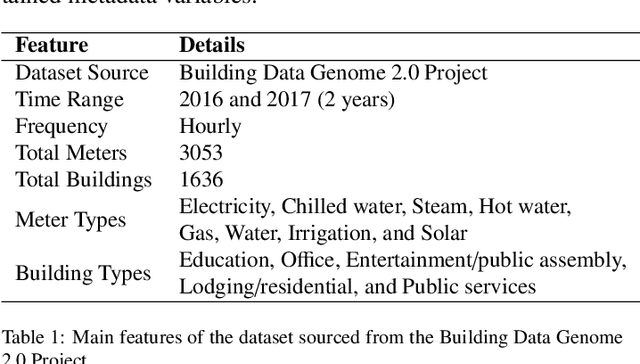
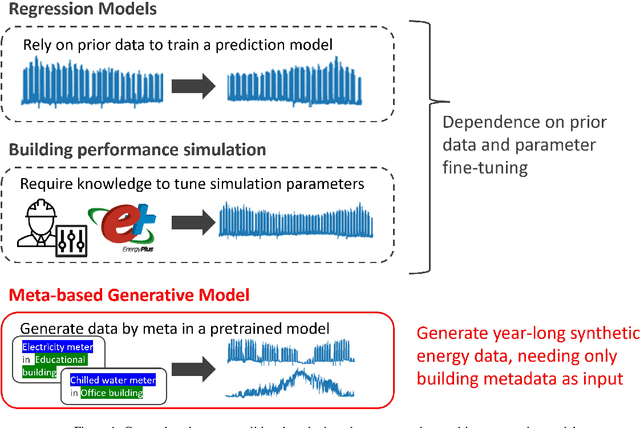

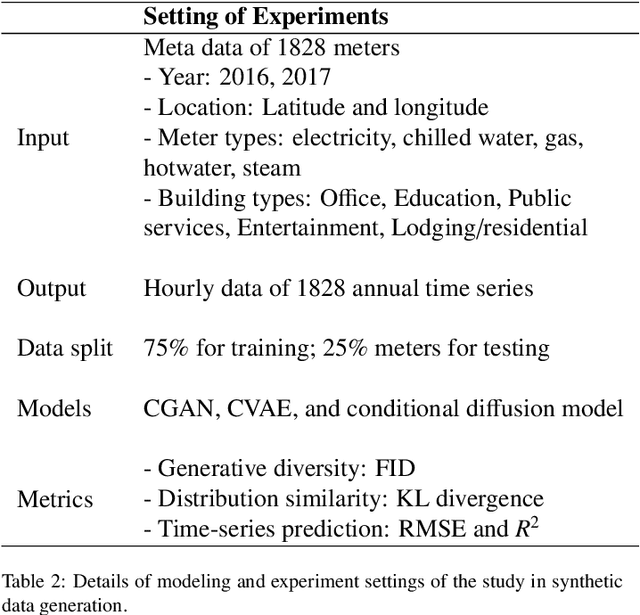
Abstract:Advances in machine learning and increased computational power have driven progress in energy-related research. However, limited access to private energy data from buildings hinders traditional regression models relying on historical data. While generative models offer a solution, previous studies have primarily focused on short-term generation periods (e.g., daily profiles) and a limited number of meters. Thus, the study proposes a conditional diffusion model for generating high-quality synthetic energy data using relevant metadata. Using a dataset comprising 1,828 power meters from various buildings and countries, this model is compared with traditional methods like Conditional Generative Adversarial Networks (CGAN) and Conditional Variational Auto-Encoders (CVAE). It explicitly handles long-term annual consumption profiles, harnessing metadata such as location, weather, building, and meter type to produce coherent synthetic data that closely resembles real-world energy consumption patterns. The results demonstrate the proposed diffusion model's superior performance, with a 36% reduction in Frechet Inception Distance (FID) score and a 13% decrease in Kullback-Leibler divergence (KL divergence) compared to the following best method. The proposed method successfully generates high-quality energy data through metadata, and its code will be open-sourced, establishing a foundation for a broader array of energy data generation models in the future.
Opening the Black Box: Towards inherently interpretable energy data imputation models using building physics insight
Nov 28, 2023Abstract:Missing data are frequently observed by practitioners and researchers in the building energy modeling community. In this regard, advanced data-driven solutions, such as Deep Learning methods, are typically required to reflect the non-linear behavior of these anomalies. As an ongoing research question related to Deep Learning, a model's applicability to limited data settings can be explored by introducing prior knowledge in the network. This same strategy can also lead to more interpretable predictions, hence facilitating the field application of the approach. For that purpose, the aim of this paper is to propose the use of Physics-informed Denoising Autoencoders (PI-DAE) for missing data imputation in commercial buildings. In particular, the presented method enforces physics-inspired soft constraints to the loss function of a Denoising Autoencoder (DAE). In order to quantify the benefits of the physical component, an ablation study between different DAE configurations is conducted. First, three univariate DAEs are optimized separately on indoor air temperature, heating, and cooling data. Then, two multivariate DAEs are derived from the previous configurations. Eventually, a building thermal balance equation is coupled to the last multivariate configuration to obtain PI-DAE. Additionally, two commonly used benchmarks are employed to support the findings. It is shown how introducing physical knowledge in a multivariate Denoising Autoencoder can enhance the inherent model interpretability through the optimized physics-based coefficients. While no significant improvement is observed in terms of reconstruction error with the proposed PI-DAE, its enhanced robustness to varying rates of missing data and the valuable insights derived from the physics-based coefficients create opportunities for wider applications within building systems and the built environment.
Semantic segmentation of longitudinal thermal images for identification of hot and cool spots in urban areas
Oct 06, 2023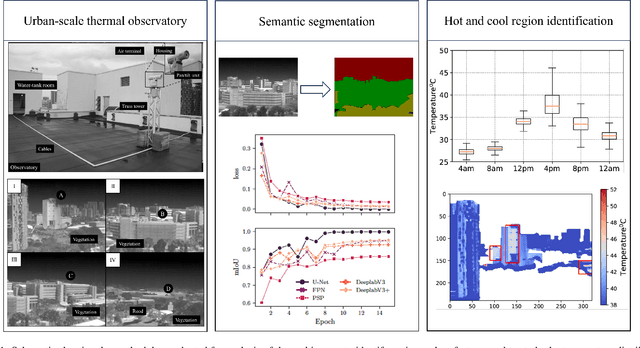
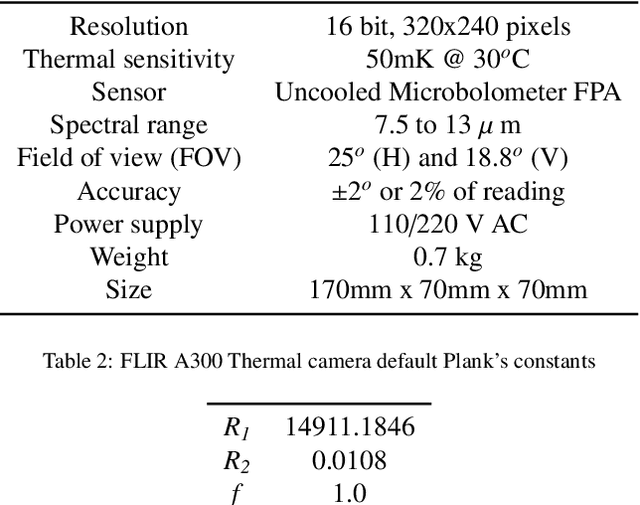
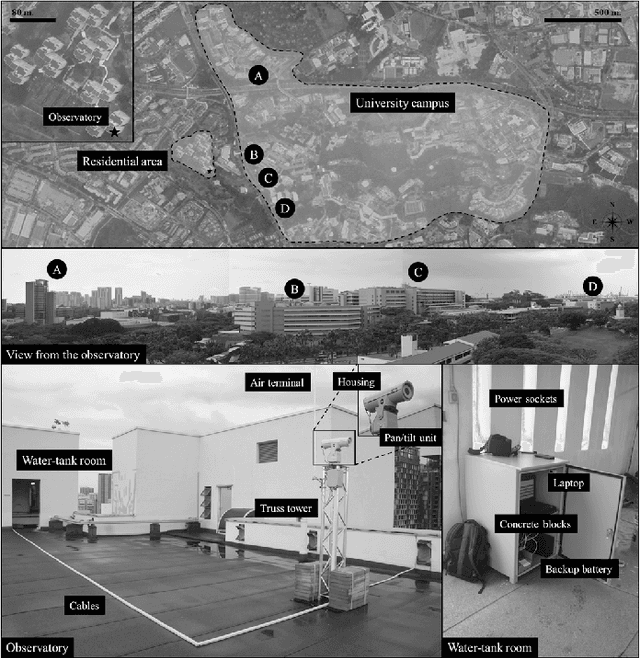
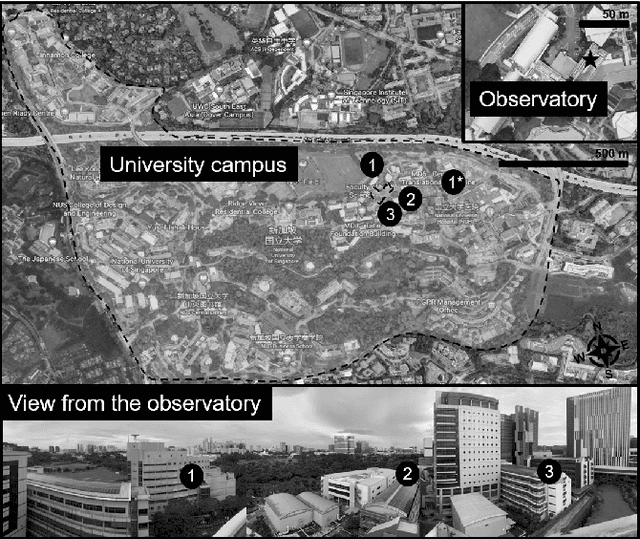
Abstract:This work presents the analysis of semantically segmented, longitudinally, and spatially rich thermal images collected at the neighborhood scale to identify hot and cool spots in urban areas. An infrared observatory was operated over a few months to collect thermal images of different types of buildings on the educational campus of the National University of Singapore. A subset of the thermal image dataset was used to train state-of-the-art deep learning models to segment various urban features such as buildings, vegetation, sky, and roads. It was observed that the U-Net segmentation model with `resnet34' CNN backbone has the highest mIoU score of 0.99 on the test dataset, compared to other models such as DeepLabV3, DeeplabV3+, FPN, and PSPnet. The masks generated using the segmentation models were then used to extract the temperature from thermal images and correct for differences in the emissivity of various urban features. Further, various statistical measure of the temperature extracted using the predicted segmentation masks is shown to closely match the temperature extracted using the ground truth masks. Finally, the masks were used to identify hot and cool spots in the urban feature at various instances of time. This forms one of the very few studies demonstrating the automated analysis of thermal images, which can be of potential use to urban planners for devising mitigation strategies for reducing the urban heat island (UHI) effect, improving building energy efficiency, and maximizing outdoor thermal comfort.
Filling time-series gaps using image techniques: Multidimensional context autoencoder approach for building energy data imputation
Jul 13, 2023Abstract:Building energy prediction and management has become increasingly important in recent decades, driven by the growth of Internet of Things (IoT) devices and the availability of more energy data. However, energy data is often collected from multiple sources and can be incomplete or inconsistent, which can hinder accurate predictions and management of energy systems and limit the usefulness of the data for decision-making and research. To address this issue, past studies have focused on imputing missing gaps in energy data, including random and continuous gaps. One of the main challenges in this area is the lack of validation on a benchmark dataset with various building and meter types, making it difficult to accurately evaluate the performance of different imputation methods. Another challenge is the lack of application of state-of-the-art imputation methods for missing gaps in energy data. Contemporary image-inpainting methods, such as Partial Convolution (PConv), have been widely used in the computer vision domain and have demonstrated their effectiveness in dealing with complex missing patterns. To study whether energy data imputation can benefit from the image-based deep learning method, this study compared PConv, Convolutional neural networks (CNNs), and weekly persistence method using one of the biggest publicly available whole building energy datasets, consisting of 1479 power meters worldwide, as the benchmark. The results show that, compared to the CNN with the raw time series (1D-CNN) and the weekly persistence method, neural network models with reshaped energy data with two dimensions reduced the Mean Squared Error (MSE) by 10% to 30%. The advanced deep learning method, Partial convolution (PConv), has further reduced the MSE by 20-30% than 2D-CNN and stands out among all models.
District-scale surface temperatures generated from high-resolution longitudinal thermal infrared images
May 03, 2023Abstract:The paper describes a dataset that was collected by infrared thermography, which is a non-contact, non-intrusive technique to collect data and analyze the built environment in various aspects. While most studies focus on the city and building scales, the rooftop observatory provides high temporal and spatial resolution observations with dynamic interactions on the district scale. The rooftop infrared thermography observatory with a multi-modal platform that is capable of assessing a wide range of dynamic processes in urban systems was deployed in Singapore. It was placed on the top of two buildings that overlook the outdoor context of the campus of the National University of Singapore. The platform collects remote sensing data from tropical areas on a temporal scale, allowing users to determine the temperature trend of individual features such as buildings, roads, and vegetation. The dataset includes 1,365,921 thermal images collected on average at approximately 10 seconds intervals from two locations during ten months.
Longitudinal thermal imaging for scalable non-residential HVAC and occupant behaviour characterization
Nov 17, 2022Abstract:This work presents a study on the characterization of the air-conditioning (AC) usage pattern of non-residential buildings from thermal images collected from an urban-scale infrared (IR) observatory. To achieve this first, an image processing scheme, for cleaning and extraction of the temperature time series from the thermal images is implemented. To test the accuracy of the thermal measurements using IR camera, the extracted temperature is compared against the ground truth surface temperature measurements. It is observed that the detrended thermal measurements match well with the ground truth surface temperature measurements. Subsequently, the operational pattern of the water-cooled systems and window AC units are extracted from the analysis of the thermal signature. It is observed that for the water-cooled system, the difference between the rate of change of the window and wall can be used to extract the operational pattern. While, in the case of the window AC units, wavelet transform of the AC unit temperature is used to extract the frequency and time domain information of the AC unit operation. The results of the analysis are compared against the indoor temperature sensors installed in the office spaces of the building. It is realized that the accuracy in the prediction of the operational pattern is highest between 8 pm to 10 am, and it reduces during the day because of solar radiation and high daytime temperature. Subsequently, a characterization study is conducted for eight window/split AC units from the thermal image collected during the nighttime. This forms one of the first studies on the operational behavior of HVAC systems for non-residential buildings using the longitudinal thermal imaging technique. The output from this study can be used to better understand the operational and occupant behavior, without requiring to deploy a large array of sensors in the building space.
Cohort comfort models -- Using occupants' similarity to predict personal thermal preference with less data
Aug 05, 2022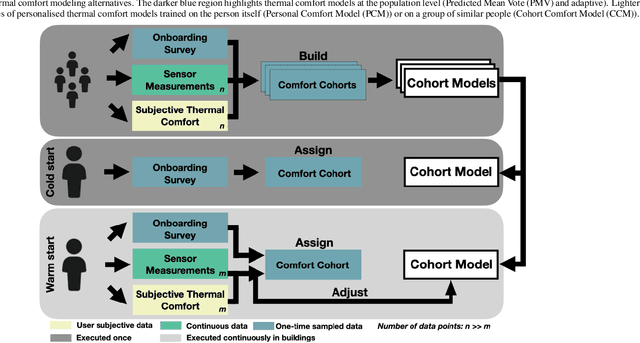
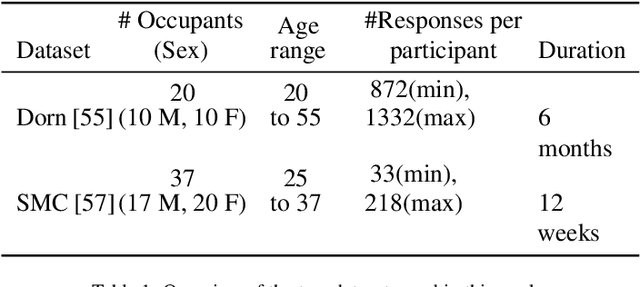

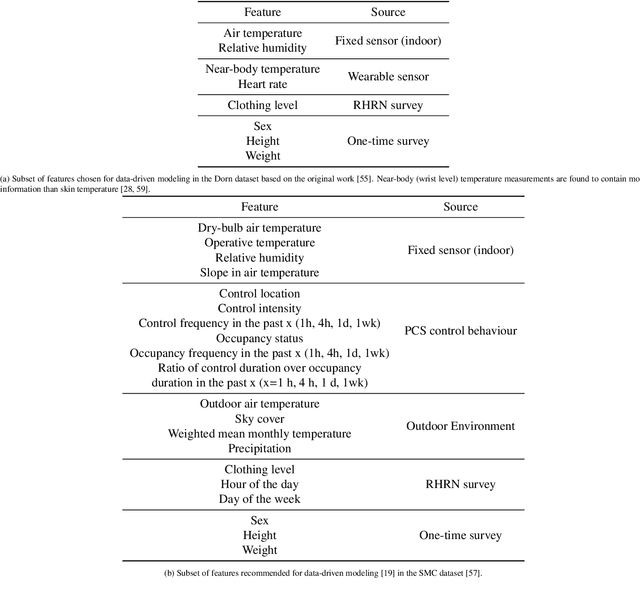
Abstract:We introduce Cohort Comfort Models, a new framework for predicting how new occupants would perceive their thermal environment. Cohort Comfort Models leverage historical data collected from a sample population, who have some underlying preference similarity, to predict thermal preference responses of new occupants. Our framework is capable of exploiting available background information such as physical characteristics and one-time on-boarding surveys (satisfaction with life scale, highly sensitive person scale, the Big Five personality traits) from the new occupant as well as physiological and environmental sensor measurements paired with thermal preference responses. We implemented our framework in two publicly available datasets containing longitudinal data from 55 people, comprising more than 6,000 individual thermal comfort surveys. We observed that, a Cohort Comfort Model that uses background information provided very little change in thermal preference prediction performance but uses none historical data. On the other hand, for half and one third of each dataset occupant population, using Cohort Comfort Models, with less historical data from target occupants, Cohort Comfort Models increased their thermal preference prediction by 8~\% and 5~\% on average, and up to 36~\% and 46~\% for some occupants, when compared to general-purpose models trained on the whole population of occupants. The framework is presented in a data and site agnostic manner, with its different components easily tailored to the data availability of the occupants and the buildings. Cohort Comfort Models can be an important step towards personalization without the need of developing a personalized model for each new occupant.
Targeting occupant feedback using digital twins: Adaptive spatial-temporal thermal preference sampling to optimize personal comfort models
Apr 11, 2022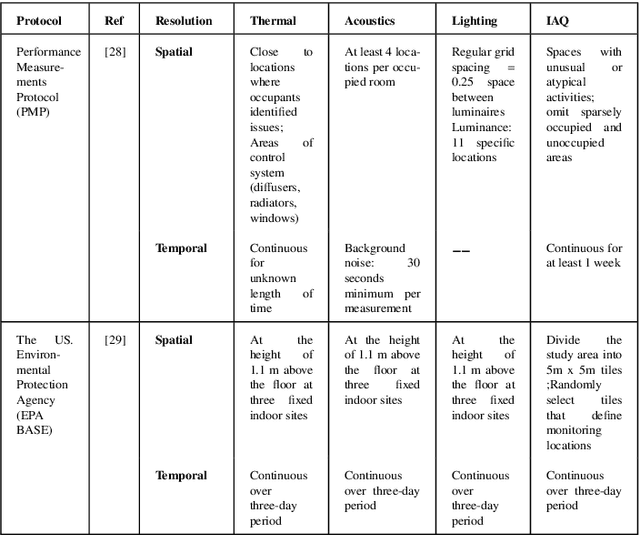

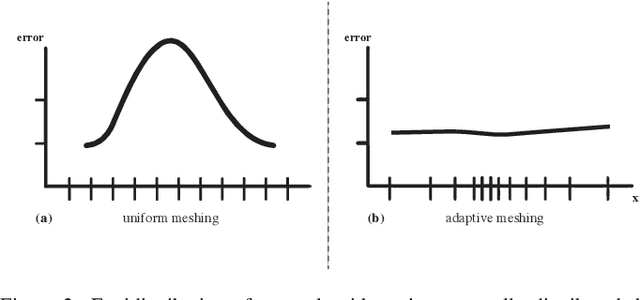

Abstract:Collecting intensive longitudinal thermal preference data from building occupants is emerging as an innovative means of characterizing the performance of buildings and the people who use them. These techniques have occupants giving subjective feedback using smartphones or smartwatches frequently over the course of days or weeks. The intention is that the data will be collected with high spatial and temporal diversity to best characterize a building and the occupant's preferences. But in reality, leaving the occupant to respond in an ad-hoc or fixed interval way creates unneeded survey fatigue and redundant data. This paper outlines a scenario-based (virtual experiment) method for optimizing data sampling using a smartwatch to achieve comparable accuracy in a personal thermal preference model with fewer data. This method uses BIM-extracted spatial data and Graph Neural Network-based (GNN) modeling to find regions of similar comfort preference to identify the best scenarios for triggering the occupant to give feedback. This method is compared to two baseline scenarios that use conventional zoning and a generic 4x4 square meter grid method from two field-based data sets. The results show that the proposed Build2Vec method has an 18-23\% higher overall sampling quality than the spaces-based and square-grid-based sampling methods. The Build2Vec method also performs similar to the baselines when removing redundant occupant feedback points but with better scalability potential.
ALDI++: Automatic and parameter-less discord and outlier detection for building energy load profiles
Mar 13, 2022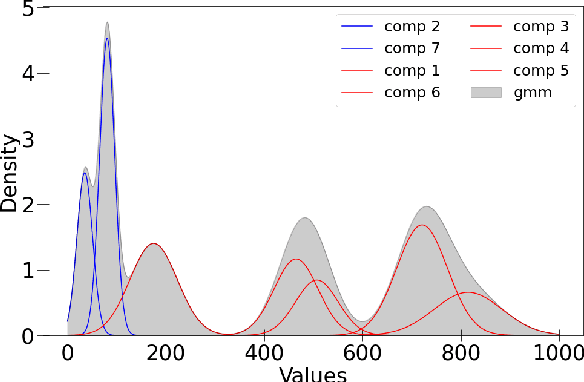

Abstract:Data-driven building energy prediction is an integral part of the process for measurement and verification, building benchmarking, and building-to-grid interaction. The ASHRAE Great Energy Predictor III (GEPIII) machine learning competition used an extensive meter data set to crowdsource the most accurate machine learning workflow for whole building energy prediction. A significant component of the winning solutions was the pre-processing phase to remove anomalous training data. Contemporary pre-processing methods focus on filtering statistical threshold values or deep learning methods requiring training data and multiple hyper-parameters. A recent method named ALDI (Automated Load profile Discord Identification) managed to identify these discords using matrix profile, but the technique still requires user-defined parameters. We develop ALDI++, a method based on the previous work that bypasses user-defined parameters and takes advantage of discord similarity. We evaluate ALDI++ against a statistical threshold, variational auto-encoder, and the original ALDI as baselines in classifying discords and energy forecasting scenarios. Our results demonstrate that while the classification performance improvement over the original method is marginal, ALDI++ helps achieve the best forecasting error improving 6% over the winning's team approach with six times less computation time.
 Add to Chrome
 Add to Firefox
 Add to Edge