Semantic segmentation of longitudinal thermal images for identification of hot and cool spots in urban areas
Paper and Code
Oct 06, 2023


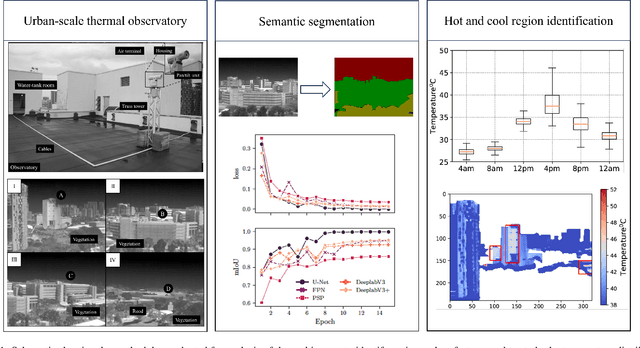
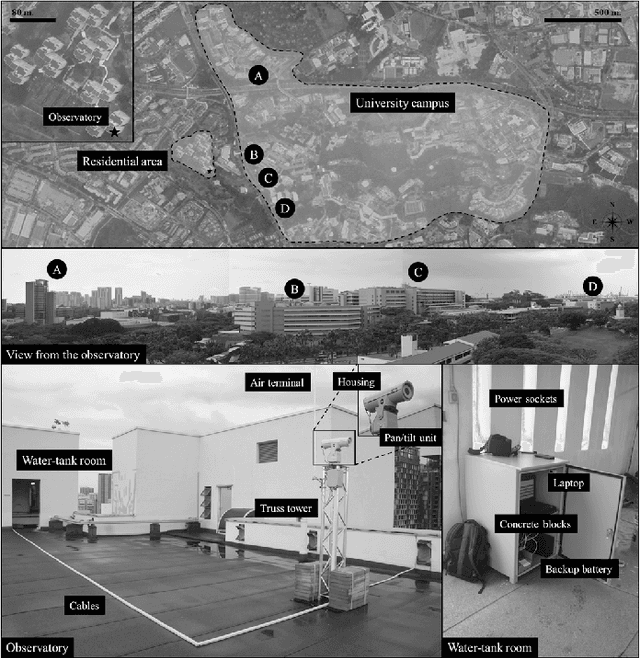
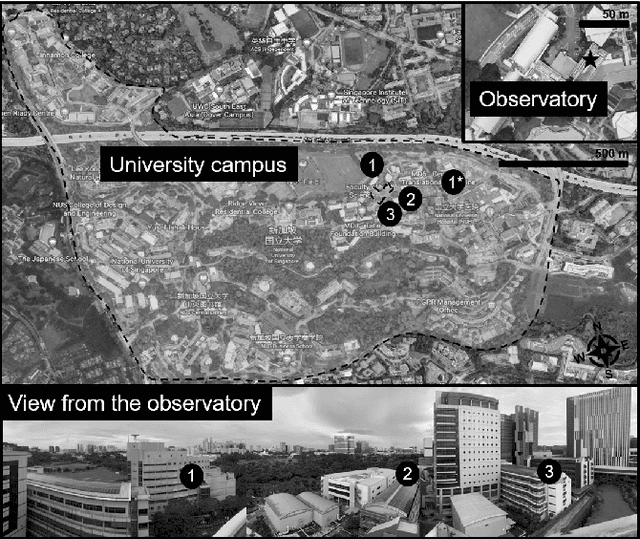
This work presents the analysis of semantically segmented, longitudinally, and spatially rich thermal images collected at the neighborhood scale to identify hot and cool spots in urban areas. An infrared observatory was operated over a few months to collect thermal images of different types of buildings on the educational campus of the National University of Singapore. A subset of the thermal image dataset was used to train state-of-the-art deep learning models to segment various urban features such as buildings, vegetation, sky, and roads. It was observed that the U-Net segmentation model with `resnet34' CNN backbone has the highest mIoU score of 0.99 on the test dataset, compared to other models such as DeepLabV3, DeeplabV3+, FPN, and PSPnet. The masks generated using the segmentation models were then used to extract the temperature from thermal images and correct for differences in the emissivity of various urban features. Further, various statistical measure of the temperature extracted using the predicted segmentation masks is shown to closely match the temperature extracted using the ground truth masks. Finally, the masks were used to identify hot and cool spots in the urban feature at various instances of time. This forms one of the very few studies demonstrating the automated analysis of thermal images, which can be of potential use to urban planners for devising mitigation strategies for reducing the urban heat island (UHI) effect, improving building energy efficiency, and maximizing outdoor thermal comfort.
 Add to Chrome
 Add to Firefox
 Add to Edge