Pandarasamy Arjunan
Generative Adversarial Network with Soft-Dynamic Time Warping and Parallel Reconstruction for Energy Time Series Anomaly Detection
Feb 22, 2024Abstract:In this paper, we employ a 1D deep convolutional generative adversarial network (DCGAN) for sequential anomaly detection in energy time series data. Anomaly detection involves gradient descent to reconstruct energy sub-sequences, identifying the noise vector that closely generates them through the generator network. Soft-DTW is used as a differentiable alternative for the reconstruction loss and is found to be superior to Euclidean distance. Combining reconstruction loss and the latent space's prior probability distribution serves as the anomaly score. Our novel method accelerates detection by parallel computation of reconstruction of multiple points and shows promise in identifying anomalous energy consumption in buildings, as evidenced by performing experiments on hourly energy time series from 15 buildings.
Semantic segmentation of longitudinal thermal images for identification of hot and cool spots in urban areas
Oct 06, 2023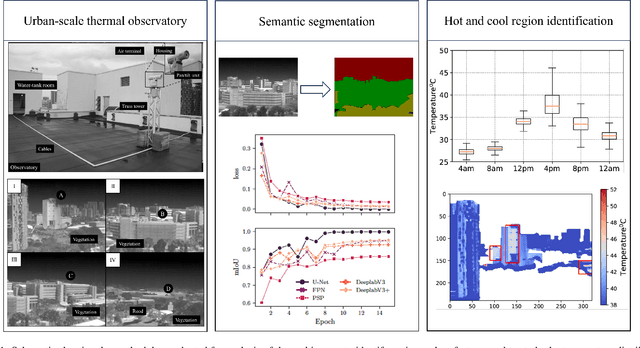
Abstract:This work presents the analysis of semantically segmented, longitudinally, and spatially rich thermal images collected at the neighborhood scale to identify hot and cool spots in urban areas. An infrared observatory was operated over a few months to collect thermal images of different types of buildings on the educational campus of the National University of Singapore. A subset of the thermal image dataset was used to train state-of-the-art deep learning models to segment various urban features such as buildings, vegetation, sky, and roads. It was observed that the U-Net segmentation model with `resnet34' CNN backbone has the highest mIoU score of 0.99 on the test dataset, compared to other models such as DeepLabV3, DeeplabV3+, FPN, and PSPnet. The masks generated using the segmentation models were then used to extract the temperature from thermal images and correct for differences in the emissivity of various urban features. Further, various statistical measure of the temperature extracted using the predicted segmentation masks is shown to closely match the temperature extracted using the ground truth masks. Finally, the masks were used to identify hot and cool spots in the urban feature at various instances of time. This forms one of the very few studies demonstrating the automated analysis of thermal images, which can be of potential use to urban planners for devising mitigation strategies for reducing the urban heat island (UHI) effect, improving building energy efficiency, and maximizing outdoor thermal comfort.
District-scale surface temperatures generated from high-resolution longitudinal thermal infrared images
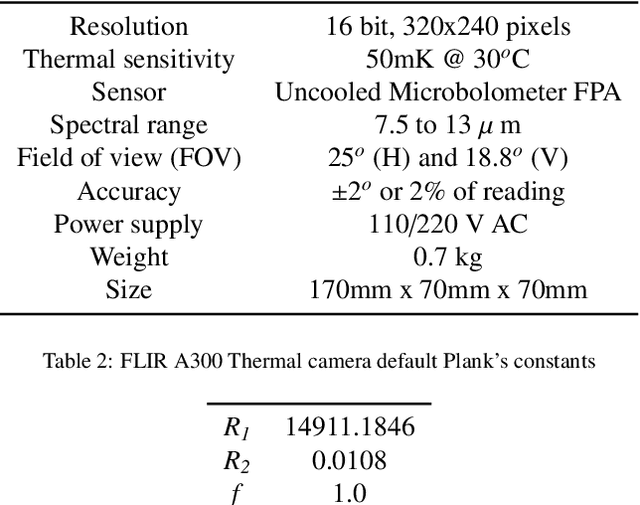
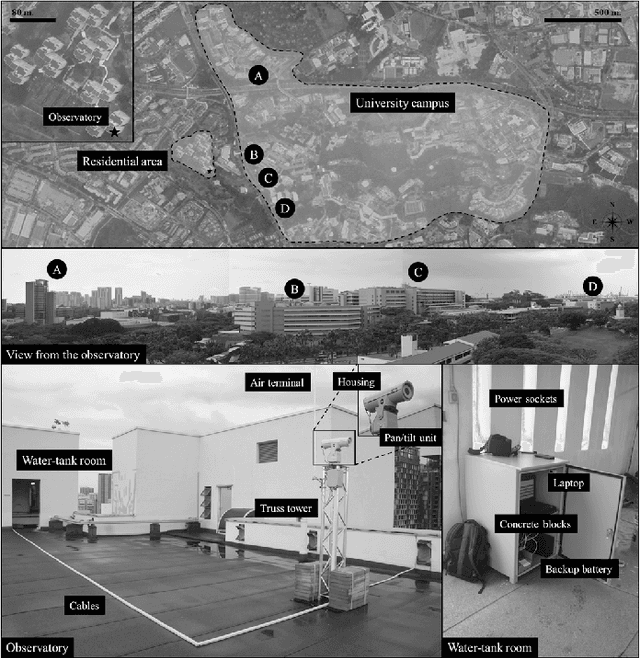
May 03, 2023Abstract:The paper describes a dataset that was collected by infrared thermography, which is a non-contact, non-intrusive technique to collect data and analyze the built environment in various aspects. While most studies focus on the city and building scales, the rooftop observatory provides high temporal and spatial resolution observations with dynamic interactions on the district scale. The rooftop infrared thermography observatory with a multi-modal platform that is capable of assessing a wide range of dynamic processes in urban systems was deployed in Singapore. It was placed on the top of two buildings that overlook the outdoor context of the campus of the National University of Singapore. The platform collects remote sensing data from tropical areas on a temporal scale, allowing users to determine the temperature trend of individual features such as buildings, roads, and vegetation. The dataset includes 1,365,921 thermal images collected on average at approximately 10 seconds intervals from two locations during ten months.
Longitudinal thermal imaging for scalable non-residential HVAC and occupant behaviour characterization
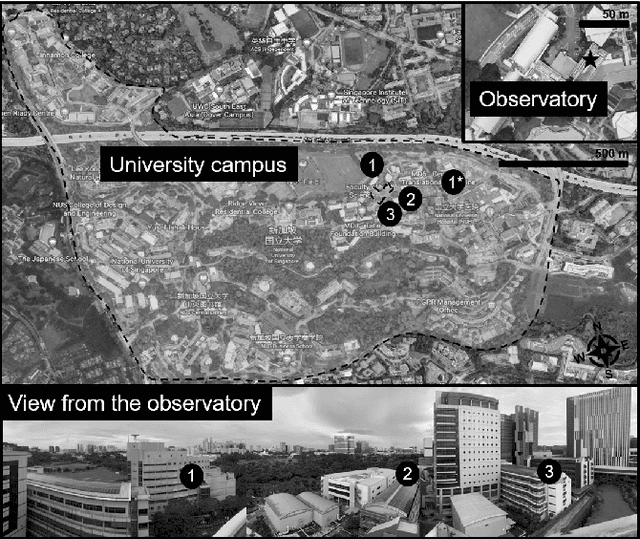
Nov 17, 2022Abstract:This work presents a study on the characterization of the air-conditioning (AC) usage pattern of non-residential buildings from thermal images collected from an urban-scale infrared (IR) observatory. To achieve this first, an image processing scheme, for cleaning and extraction of the temperature time series from the thermal images is implemented. To test the accuracy of the thermal measurements using IR camera, the extracted temperature is compared against the ground truth surface temperature measurements. It is observed that the detrended thermal measurements match well with the ground truth surface temperature measurements. Subsequently, the operational pattern of the water-cooled systems and window AC units are extracted from the analysis of the thermal signature. It is observed that for the water-cooled system, the difference between the rate of change of the window and wall can be used to extract the operational pattern. While, in the case of the window AC units, wavelet transform of the AC unit temperature is used to extract the frequency and time domain information of the AC unit operation. The results of the analysis are compared against the indoor temperature sensors installed in the office spaces of the building. It is realized that the accuracy in the prediction of the operational pattern is highest between 8 pm to 10 am, and it reduces during the day because of solar radiation and high daytime temperature. Subsequently, a characterization study is conducted for eight window/split AC units from the thermal image collected during the nighttime. This forms one of the first studies on the operational behavior of HVAC systems for non-residential buildings using the longitudinal thermal imaging technique. The output from this study can be used to better understand the operational and occupant behavior, without requiring to deploy a large array of sensors in the building space.
LEAD1.0: A Large-scale Annotated Dataset for Energy Anomaly Detection in Commercial Buildings
Mar 30, 2022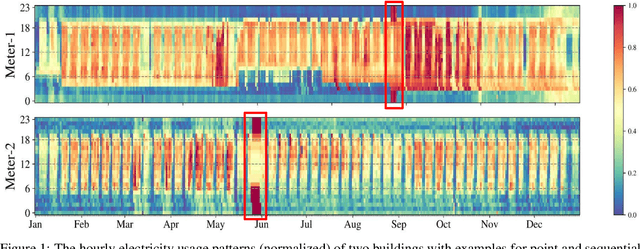
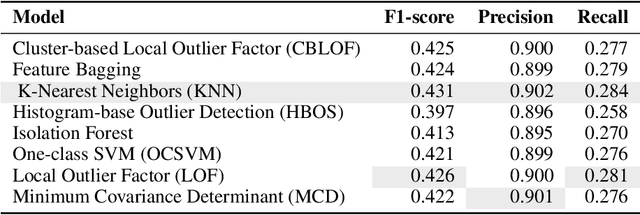
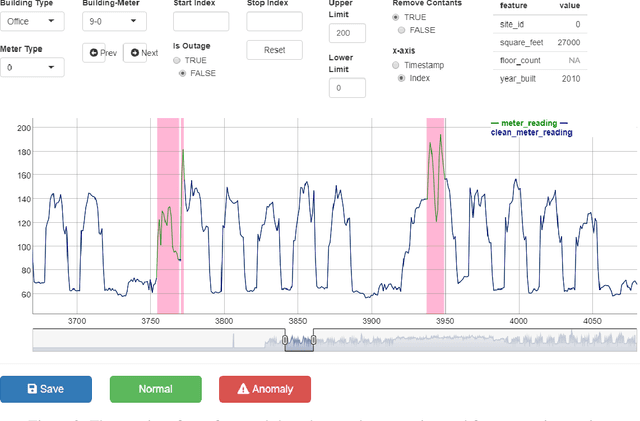
Abstract:Modern buildings are densely equipped with smart energy meters, which periodically generate a massive amount of time-series data yielding few million data points every day. This data can be leveraged to discover the underlying loads, infer their energy consumption patterns, inter-dependencies on environmental factors, and the building's operational properties. Furthermore, it allows us to simultaneously identify anomalies present in the electricity consumption profiles, which is a big step towards saving energy and achieving global sustainability. However, to date, the lack of large-scale annotated energy consumption datasets hinders the ongoing research in anomaly detection. We contribute to this effort by releasing a well-annotated version of a publicly available ASHRAE Great Energy Predictor III data set containing 1,413 smart electricity meter time series spanning over one year. In addition, we benchmark the performance of eight state-of-the-art anomaly detection methods on our dataset and compare their performance.
EnergyStar++: Towards more accurate and explanatory building energy benchmarking
Oct 30, 2019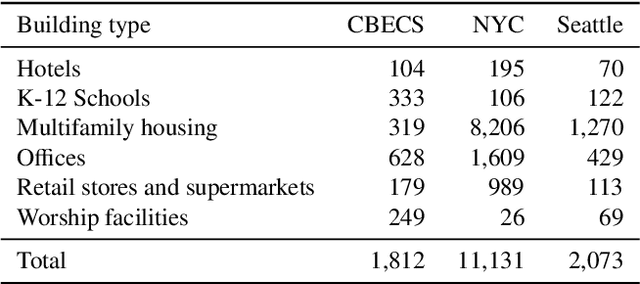


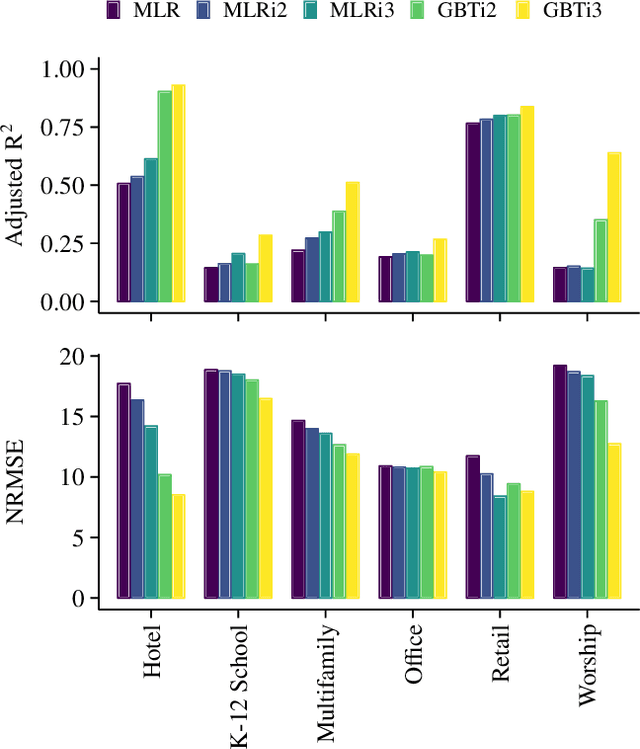
Abstract:Building energy performance benchmarking has been adopted widely in the USA and Canada through the Energy Star Portfolio Manager platform. Building operations and energy management professionals have long used a simple 1-100 score to understand how their building compares to its peers. This single number is easy to use, but is created by inaccurate linear regression (MLR) models. This paper proposes a methodology that enhances the existing Energy Star calculation method by increasing accuracy and providing additional model output processing to help explain why a building is achieving a certain score. We propose and test two new prediction models: multiple linear regression with feature interactions (MLRi) and gradient boosted trees (GBT). Both models have better average accuracy than the baseline Energy Star models. The third order MLRi and GBT models achieve 4.9% and 24.9% increase in adjusted R2, respectively, and 7.0% and 13.7% decrease in normalized root mean squared error (NRMSE), respectively, on average than MLR models for six building types. Even more importantly, a set of techniques is developed to help determine which factors most influence the score using SHAP values. The SHAP force visualization in particular offers an accessible overview of the aspects of the building that influence the score that non-technical users can readily interpret. This methodology is tested on the 2012 Commercial Building Energy Consumption Survey (CBECS)(1,812 buildings) and public data sets from the energy disclosure programs of New York City (11,131 buildings) and Seattle (2,073 buildings).
 Add to Chrome
 Add to Firefox
 Add to Edge