Benjamin Schäfer
Explainable time-series forecasting with sampling-free SHAP for Transformers
Dec 23, 2025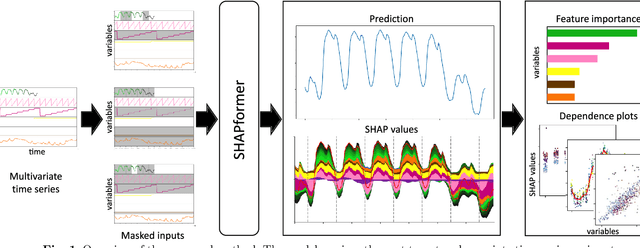

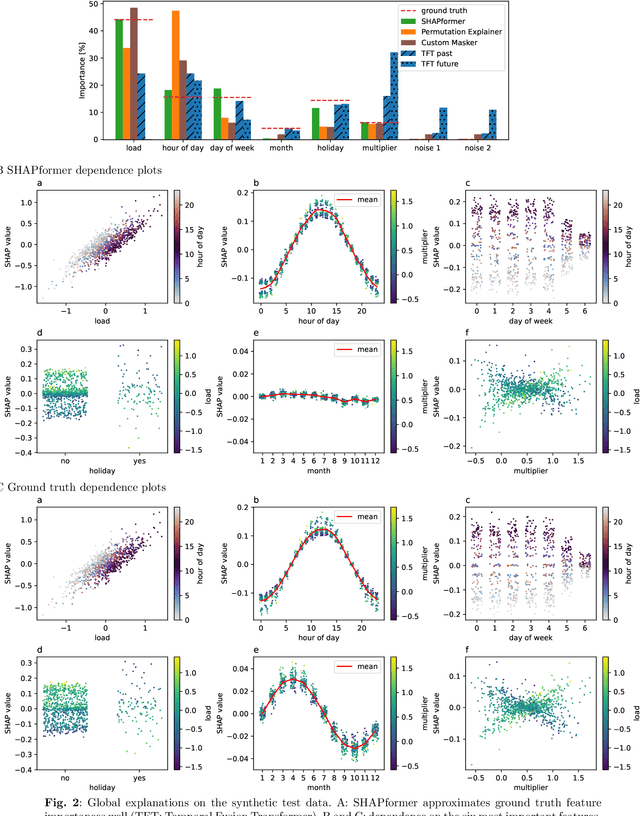
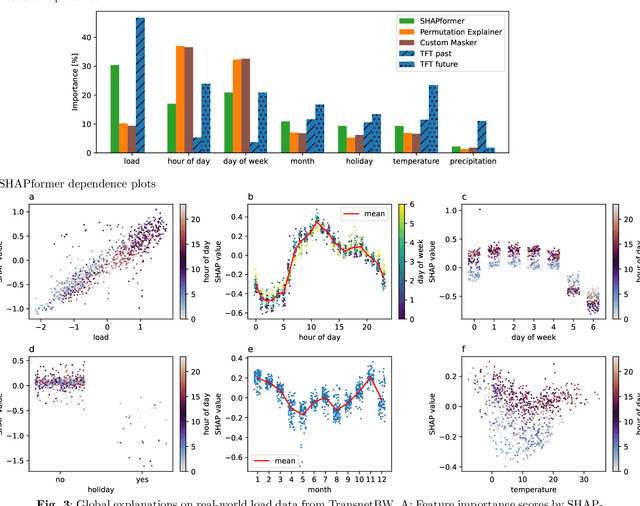
Abstract:Time-series forecasts are essential for planning and decision-making in many domains. Explainability is key to building user trust and meeting transparency requirements. Shapley Additive Explanations (SHAP) is a popular explainable AI framework, but it lacks efficient implementations for time series and often assumes feature independence when sampling counterfactuals. We introduce SHAPformer, an accurate, fast and sampling-free explainable time-series forecasting model based on the Transformer architecture. It leverages attention manipulation to make predictions based on feature subsets. SHAPformer generates explanations in under one second, several orders of magnitude faster than the SHAP Permutation Explainer. On synthetic data with ground truth explanations, SHAPformer provides explanations that are true to the data. Applied to real-world electrical load data, it achieves competitive predictive performance and delivers meaningful local and global insights, such as identifying the past load as the key predictor and revealing a distinct model behavior during the Christmas period.
Analyzing Spatio-Temporal Dynamics of Dissolved Oxygen for the River Thames using Superstatistical Methods and Machine Learning
Jan 10, 2025Abstract:By employing superstatistical methods and machine learning, we analyze time series data of water quality indicators for the River Thames, with a specific focus on the dynamics of dissolved oxygen. After detrending, the probability density functions of dissolved oxygen fluctuations exhibit heavy tails that are effectively modeled using $q$-Gaussian distributions. Our findings indicate that the multiplicative Empirical Mode Decomposition method stands out as the most effective detrending technique, yielding the highest log-likelihood in nearly all fittings. We also observe that the optimally fitted width parameter of the $q$-Gaussian shows a negative correlation with the distance to the sea, highlighting the influence of geographical factors on water quality dynamics. In the context of same-time prediction of dissolved oxygen, regression analysis incorporating various water quality indicators and temporal features identify the Light Gradient Boosting Machine as the best model. SHapley Additive exPlanations reveal that temperature, pH, and time of year play crucial roles in the predictions. Furthermore, we use the Transformer to forecast dissolved oxygen concentrations. For long-term forecasting, the Informer model consistently delivers superior performance, achieving the lowest MAE and SMAPE with the 192 historical time steps that we used. This performance is attributed to the Informer's ProbSparse self-attention mechanism, which allows it to capture long-range dependencies in time-series data more effectively than other machine learning models. It effectively recognizes the half-life cycle of dissolved oxygen, with particular attention to key intervals. Our findings provide valuable insights for policymakers involved in ecological health assessments, aiding in accurate predictions of river water quality and the maintenance of healthy aquatic ecosystems.
Why Reinforcement Learning in Energy Systems Needs Explanations
May 29, 2024
Abstract:With economic development, the complexity of infrastructure has increased drastically. Similarly, with the shift from fossil fuels to renewable sources of energy, there is a dire need for such systems that not only predict and forecast with accuracy but also help in understanding the process of predictions. Artificial intelligence and machine learning techniques have helped in finding out wellperforming solutions to different problems in the energy sector. However, the usage of state-of-the-art techniques like reinforcement learning is not surprisingly convincing. This paper discusses the application of reinforcement techniques in energy systems and how explanations of these models can be helpful
An Explainable Framework for Machine learning-Based Reactive Power Optimization of Distribution Network
Nov 07, 2023


Abstract:To reduce the heavy computational burden of reactive power optimization of distribution networks, machine learning models are receiving increasing attention. However, most machine learning models (e.g., neural networks) are usually considered as black boxes, making it challenging for power system operators to identify and comprehend potential biases or errors in the decision-making process of machine learning models. To address this issue, an explainable machine-learning framework is proposed to optimize the reactive power in distribution networks. Firstly, a Shapley additive explanation framework is presented to measure the contribution of each input feature to the solution of reactive power optimizations generated from machine learning models. Secondly, a model-agnostic approximation method is developed to estimate Shapley values, so as to avoid the heavy computational burden associated with direct calculations of Shapley values. The simulation results show that the proposed explainable framework can accurately explain the solution of the machine learning model-based reactive power optimization by using visual analytics, from both global and instance perspectives. Moreover, the proposed explainable framework is model-agnostic, and thus applicable to various models (e.g., neural networks).
Probabilistic Forecasting of Day-Ahead Electricity Prices and their Volatility with LSTMs
Oct 05, 2023Abstract:Accurate forecasts of electricity prices are crucial for the management of electric power systems and the development of smart applications. European electricity prices have risen substantially and became highly volatile after the Russian invasion of Ukraine, challenging established forecasting methods. Here, we present a Long Short-Term Memory (LSTM) model for the German-Luxembourg day-ahead electricity prices addressing these challenges. The recurrent structure of the LSTM allows the model to adapt to trends, while the joint prediction of both mean and standard deviation enables a probabilistic prediction. Using a physics-inspired approach - superstatistics - to derive an explanation for the statistics of prices, we show that the LSTM model faithfully reproduces both prices and their volatility.
Transformer Training Strategies for Forecasting Multiple Load Time Series
Jun 19, 2023Abstract:Recent work uses Transformers for load forecasting, which are the state of the art for sequence modeling tasks in data-rich domains. In the smart grid of the future, accurate load forecasts must be provided on the level of individual clients of an energy supplier. While the total amount of electrical load data available to an energy supplier will increase with the ongoing smart meter rollout, the amount of data per client will always be limited. We test whether the Transformer benefits from a transfer learning strategy, where a global model is trained on the load time series data from multiple clients. We find that the global model is superior to two other training strategies commonly used in related work: multivariate models and local models. A comparison to linear models and multi-layer perceptrons shows that Transformers are effective for electrical load forecasting when they are trained with the right strategy.
Understanding electricity prices beyond the merit order principle using explainable AI
Dec 09, 2022


Abstract:Electricity prices in liberalized markets are determined by the supply and demand for electric power, which are in turn driven by various external influences that vary strongly in time. In perfect competition, the merit order principle describes that dispatchable power plants enter the market in the order of their marginal costs to meet the residual load, i.e. the difference of load and renewable generation. Many market models implement this principle to predict electricity prices but typically require certain assumptions and simplifications. In this article, we present an explainable machine learning model for the prices on the German day-ahead market, which substantially outperforms a benchmark model based on the merit order principle. Our model is designed for the ex-post analysis of prices and thus builds on various external features. Using Shapley Additive exPlanation (SHAP) values, we can disentangle the role of the different features and quantify their importance from empiric data. Load, wind and solar generation are most important, as expected, but wind power appears to affect prices stronger than solar power does. Fuel prices also rank highly and show nontrivial dependencies, including strong interactions with other features revealed by a SHAP interaction analysis. Large generation ramps are correlated with high prices, again with strong feature interactions, due to the limited flexibility of nuclear and lignite plants. Our results further contribute to model development by providing quantitative insights directly from data.
Predicting the power grid frequency of European islands
Sep 27, 2022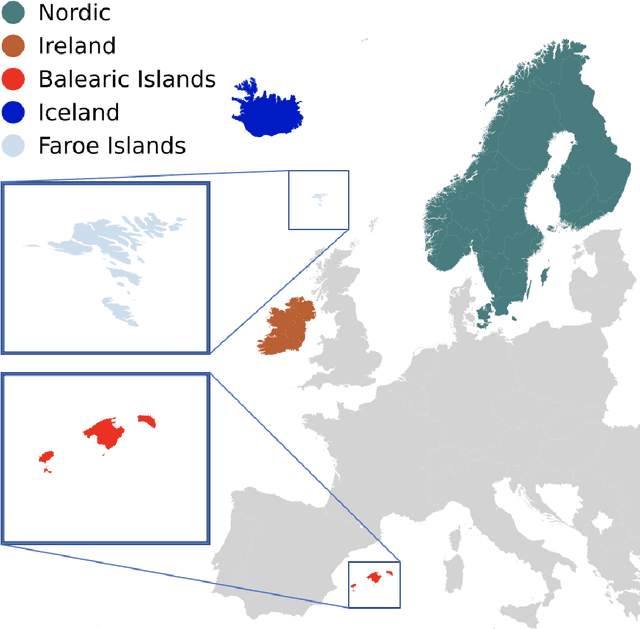
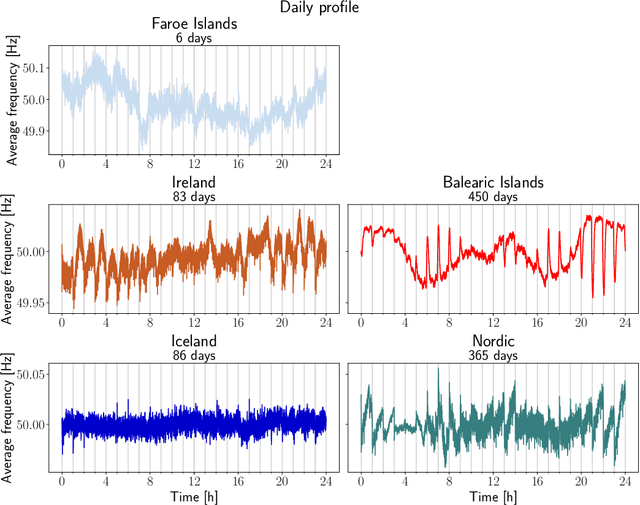

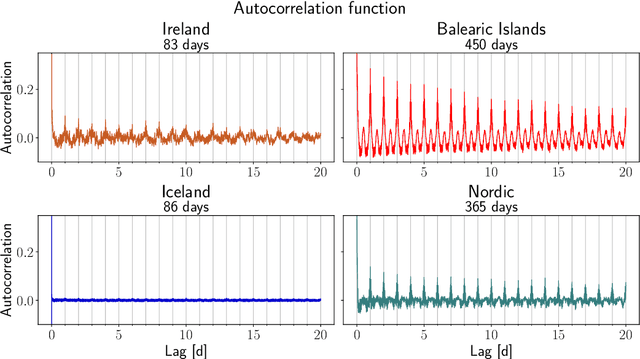
Abstract:Modelling, forecasting and overall understanding of the dynamics of the power grid and its frequency is essential for the safe operation of existing and future power grids. Much previous research was focused on large continental areas, while small systems, such as islands are less well-studied. These natural island systems are ideal testing environments for microgrid proposals and artificially islanded grid operation. In the present paper, we utilize measurements of the power grid frequency obtained in European islands: the Faroe Islands, Ireland, the Balearic Islands and Iceland and investigate how their frequency can be predicted, compared to the Nordic power system, acting as a reference. The Balearic islands are found to be particularly deterministic and easy to predict in contrast to hard-to-predict Iceland. Furthermore, we show that typically 2-4 weeks of data are needed to improve prediction performance beyond simple benchmarks.
Revealing interactions between HVDC cross-area flows and frequency stability with explainable AI
Apr 22, 2022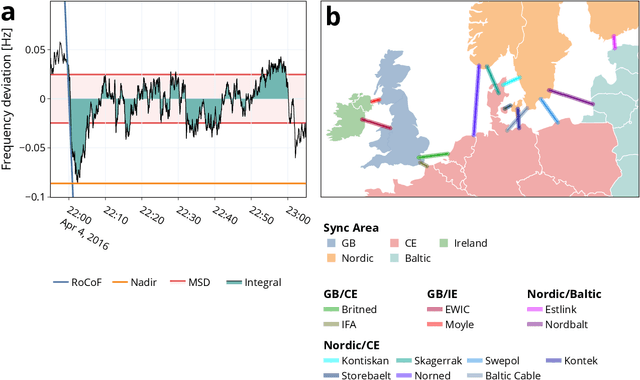

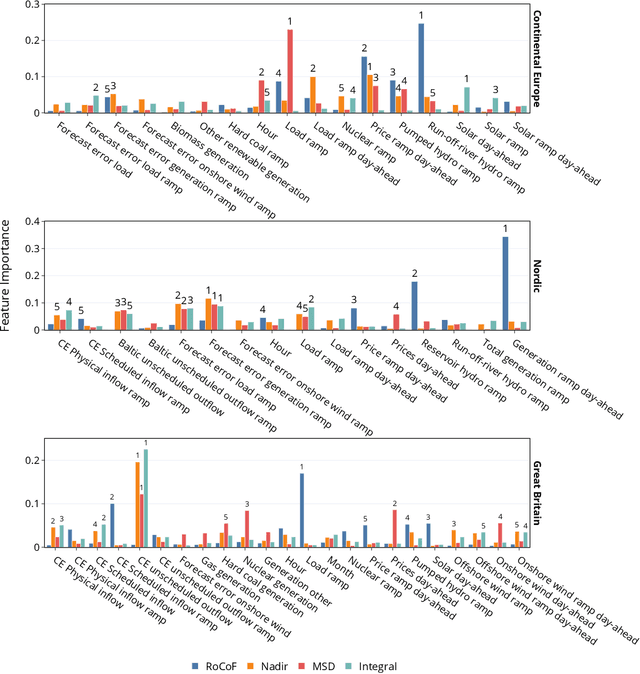
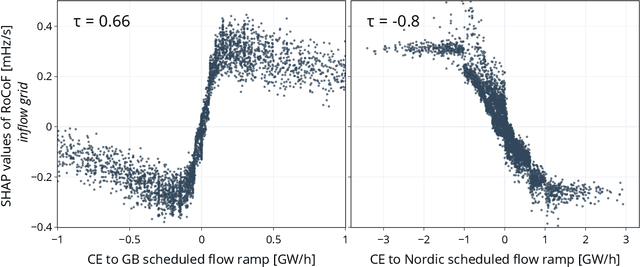
Abstract:The energy transition introduces more volatile energy sources into the power grids. In this context, power transfer between different synchronous areas through High Voltage Direct Current (HVDC) links becomes increasingly important. Such links can balance volatile generation by enabling long-distance transport or by leveraging their fast control behavior. Here, we investigate the interaction of power imbalances - represented through the power grid frequency - and power flows on HVDC links between synchronous areas in Europe. We use explainable machine learning to identify key dependencies and disentangle the interaction of critical features. Our results show that market-based HVDC flows introduce deterministic frequency deviations, which however can be mitigated through strict ramping limits. Moreover, varying HVDC operation modes strongly affect the interaction with the grid. In particular, we show that load-frequency control via HVDC links can both have control-like or disturbance-like impacts on frequency stability.
Validation Methods for Energy Time Series Scenarios from Deep Generative Models
Oct 27, 2021
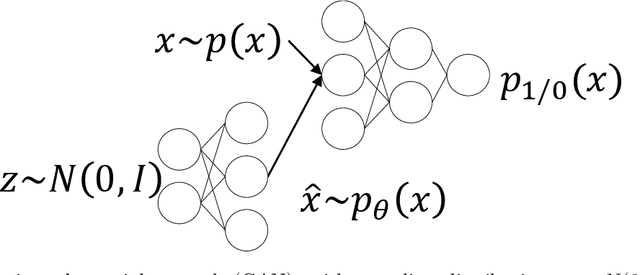

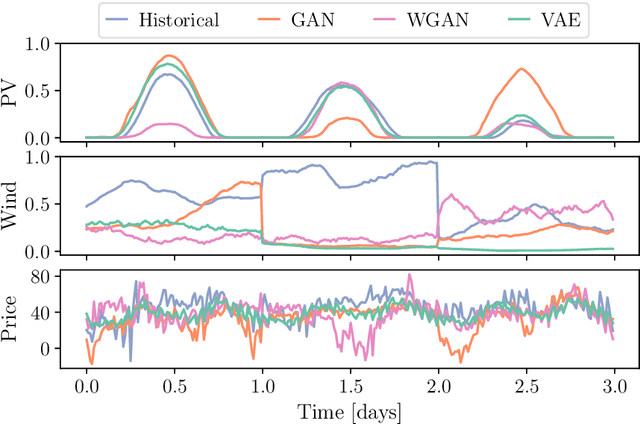
Abstract:The design and operation of modern energy systems are heavily influenced by time-dependent and uncertain parameters, e.g., renewable electricity generation, load-demand, and electricity prices. These are typically represented by a set of discrete realizations known as scenarios. A popular scenario generation approach uses deep generative models (DGM) that allow scenario generation without prior assumptions about the data distribution. However, the validation of generated scenarios is difficult, and a comprehensive discussion about appropriate validation methods is currently lacking. To start this discussion, we provide a critical assessment of the currently used validation methods in the energy scenario generation literature. In particular, we assess validation methods based on probability density, auto-correlation, and power spectral density. Furthermore, we propose using the multifractal detrended fluctuation analysis (MFDFA) as an additional validation method for non-trivial features like peaks, bursts, and plateaus. As representative examples, we train generative adversarial networks (GANs), Wasserstein GANs (WGANs), and variational autoencoders (VAEs) on two renewable power generation time series (photovoltaic and wind from Germany in 2013 to 2015) and an intra-day electricity price time series form the European Energy Exchange in 2017 to 2019. We apply the four validation methods to both the historical and the generated data and discuss the interpretation of validation results as well as common mistakes, pitfalls, and limitations of the validation methods. Our assessment shows that no single method sufficiently characterizes a scenario but ideally validation should include multiple methods and be interpreted carefully in the context of scenarios over short time periods.
 Add to Chrome
 Add to Firefox
 Add to Edge