Maximilian Beichter
LeDiFlow: Learned Distribution-guided Flow Matching to Accelerate Image Generation
May 27, 2025Abstract:Enhancing the efficiency of high-quality image generation using Diffusion Models (DMs) is a significant challenge due to the iterative nature of the process. Flow Matching (FM) is emerging as a powerful generative modeling paradigm based on a simulation-free training objective instead of a score-based one used in DMs. Typical FM approaches rely on a Gaussian distribution prior, which induces curved, conditional probability paths between the prior and target data distribution. These curved paths pose a challenge for the Ordinary Differential Equation (ODE) solver, requiring a large number of inference calls to the flow prediction network. To address this issue, we present Learned Distribution-guided Flow Matching (LeDiFlow), a novel scalable method for training FM-based image generation models using a better-suited prior distribution learned via a regression-based auxiliary model. By initializing the ODE solver with a prior closer to the target data distribution, LeDiFlow enables the learning of more computationally tractable probability paths. These paths directly translate to fewer solver steps needed for high-quality image generation at inference time. Our method utilizes a State-Of-The-Art (SOTA) transformer architecture combined with latent space sampling and can be trained on a consumer workstation. We empirically demonstrate that LeDiFlow remarkably outperforms the respective FM baselines. For instance, when operating directly on pixels, our model accelerates inference by up to 3.75x compared to the corresponding pixel-space baseline. Simultaneously, our latent FM model enhances image quality on average by 1.32x in CLIP Maximum Mean Discrepancy (CMMD) metric against its respective baseline.
EAP4EMSIG -- Enhancing Event-Driven Microscopy for Microfluidic Single-Cell Analysis
Mar 30, 2025Abstract:Microfluidic Live-Cell Imaging yields data on microbial cell factories. However, continuous acquisition is challenging as high-throughput experiments often lack realtime insights, delaying responses to stochastic events. We introduce three components in the Experiment Automation Pipeline for Event-Driven Microscopy to Smart Microfluidic Single-Cell Analysis: a fast, accurate Deep Learning autofocusing method predicting the focus offset, an evaluation of real-time segmentation methods and a realtime data analysis dashboard. Our autofocusing achieves a Mean Absolute Error of 0.0226\textmu m with inference times below 50~ms. Among eleven Deep Learning segmentation methods, Cellpose~3 reached a Panoptic Quality of 93.58\%, while a distance-based method is fastest (121~ms, Panoptic Quality 93.02\%). All six Deep Learning Foundation Models were unsuitable for real-time segmentation.
Decision-Focused Fine-Tuning of Time Series Foundation Models for Dispatchable Feeder Optimization
Mar 03, 2025Abstract:Time series foundation models provide a universal solution for generating forecasts to support optimization problems in energy systems. Those foundation models are typically trained in a prediction-focused manner to maximize forecast quality. In contrast, decision-focused learning directly improves the resulting value of the forecast in downstream optimization rather than merely maximizing forecasting quality. The practical integration of forecast values into forecasting models is challenging, particularly when addressing complex applications with diverse instances, such as buildings. This becomes even more complicated when instances possess specific characteristics that require instance-specific, tailored predictions to increase the forecast value. To tackle this challenge, we use decision-focused fine-tuning within time series foundation models to offer a scalable and efficient solution for decision-focused learning applied to the dispatchable feeder optimization problem. To obtain more robust predictions for scarce building data, we use Moirai as a state-of-the-art foundation model, which offers robust and generalized results with few-shot parameter-efficient fine-tuning. Comparing the decision-focused fine-tuned Moirai with a state-of-the-art classical prediction-focused fine-tuning Morai, we observe an improvement of 9.45% in average total daily costs.
On autoregressive deep learning models for day-ahead wind power forecasting with irregular shutdowns due to redispatching
Nov 30, 2024


Abstract:Renewable energies and their operation are becoming increasingly vital for the stability of electrical power grids since conventional power plants are progressively being displaced, and their contribution to redispatch interventions is thereby diminishing. In order to consider renewable energies like Wind Power (WP) for such interventions as a substitute, day-ahead forecasts are necessary to communicate their availability for redispatch planning. In this context, automated and scalable forecasting models are required for the deployment to thousands of locally-distributed onshore WP turbines. Furthermore, the irregular interventions into the WP generation capabilities due to redispatch shutdowns pose challenges in the design and operation of WP forecasting models. Since state-of-the-art forecasting methods consider past WP generation values alongside day-ahead weather forecasts, redispatch shutdowns may impact the forecast. Therefore, the present paper highlights these challenges and analyzes state-of-the-art forecasting methods on data sets with both regular and irregular shutdowns. Specifically, we compare the forecasting accuracy of three autoregressive Deep Learning (DL) methods to methods based on WP curve modeling. Interestingly, the latter achieve lower forecasting errors, have fewer requirements for data cleaning during modeling and operation while being computationally more efficient, suggesting their advantages in practical applications.
EAP4EMSIG -- Experiment Automation Pipeline for Event-Driven Microscopy to Smart Microfluidic Single-Cells Analysis
Nov 06, 2024Abstract:Microfluidic Live-Cell Imaging (MLCI) generates high-quality data that allows biotechnologists to study cellular growth dynamics in detail. However, obtaining these continuous data over extended periods is challenging, particularly in achieving accurate and consistent real-time event classification at the intersection of imaging and stochastic biology. To address this issue, we introduce the Experiment Automation Pipeline for Event-Driven Microscopy to Smart Microfluidic Single-Cells Analysis (EAP4EMSIG). In particular, we present initial zero-shot results from the real-time segmentation module of our approach. Our findings indicate that among four State-Of-The- Art (SOTA) segmentation methods evaluated, Omnipose delivers the highest Panoptic Quality (PQ) score of 0.9336, while Contour Proposal Network (CPN) achieves the fastest inference time of 185 ms with the second-highest PQ score of 0.8575. Furthermore, we observed that the vision foundation model Segment Anything is unsuitable for this particular use case.
Transformer Training Strategies for Forecasting Multiple Load Time Series
Jun 19, 2023Abstract:Recent work uses Transformers for load forecasting, which are the state of the art for sequence modeling tasks in data-rich domains. In the smart grid of the future, accurate load forecasts must be provided on the level of individual clients of an energy supplier. While the total amount of electrical load data available to an energy supplier will increase with the ongoing smart meter rollout, the amount of data per client will always be limited. We test whether the Transformer benefits from a transfer learning strategy, where a global model is trained on the load time series data from multiple clients. We find that the global model is superior to two other training strategies commonly used in related work: multivariate models and local models. A comparison to linear models and multi-layer perceptrons shows that Transformers are effective for electrical load forecasting when they are trained with the right strategy.
Towards Automatic Parsing of Structured Visual Content through the Use of Synthetic Data
Apr 29, 2022


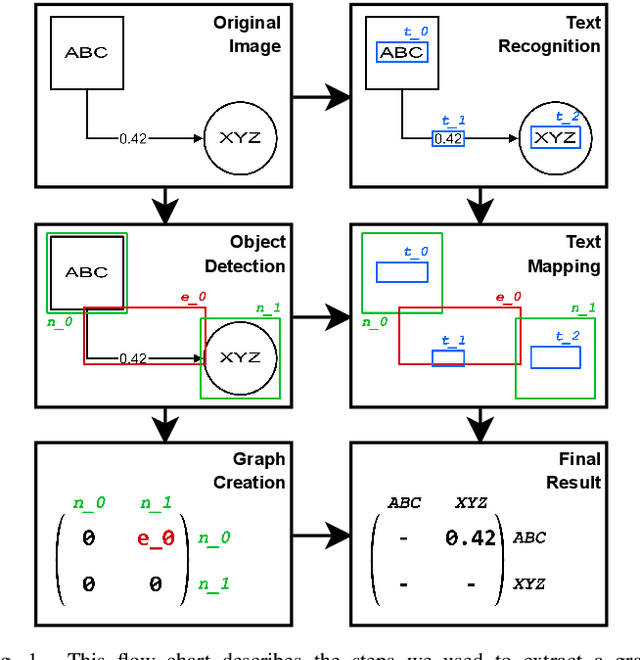
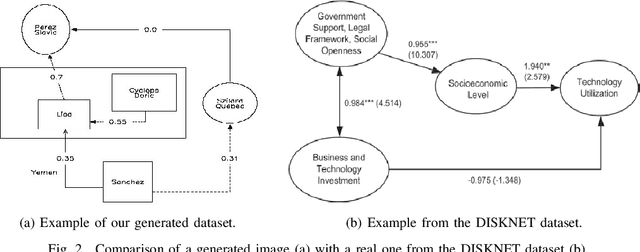
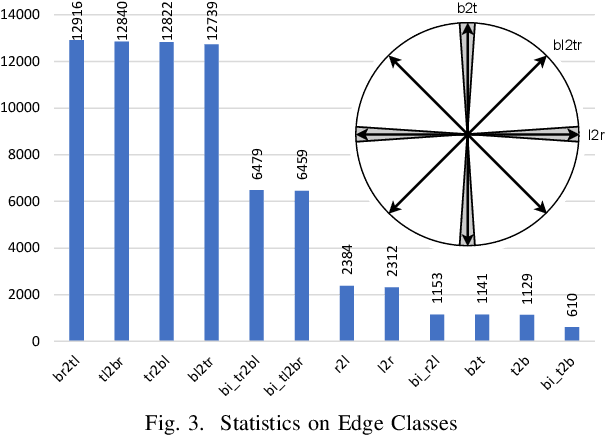
Abstract:Structured Visual Content (SVC) such as graphs, flow charts, or the like are used by authors to illustrate various concepts. While such depictions allow the average reader to better understand the contents, images containing SVCs are typically not machine-readable. This, in turn, not only hinders automated knowledge aggregation, but also the perception of displayed in-formation for visually impaired people. In this work, we propose a synthetic dataset, containing SVCs in the form of images as well as ground truths. We show the usage of this dataset by an application that automatically extracts a graph representation from an SVC image. This is done by training a model via common supervised learning methods. As there currently exist no large-scale public datasets for the detailed analysis of SVC, we propose the Synthetic SVC (SSVC) dataset comprising 12,000 images with respective bounding box annotations and detailed graph representations. Our dataset enables the development of strong models for the interpretation of SVCs while skipping the time-consuming dense data annotation. We evaluate our model on both synthetic and manually annotated data and show the transferability of synthetic to real via various metrics, given the presented application. Here, we evaluate that this proof of concept is possible to some extend and lay down a solid baseline for this task. We discuss the limitations of our approach for further improvements. Our utilized metrics can be used as a tool for future comparisons in this domain. To enable further research on this task, the dataset is publicly available at https://bit.ly/3jN1pJJ
 Add to Chrome
 Add to Firefox
 Add to Edge