Thorsten Schwarz
Alt4Blind: A User Interface to Simplify Charts Alt-Text Creation
May 29, 2024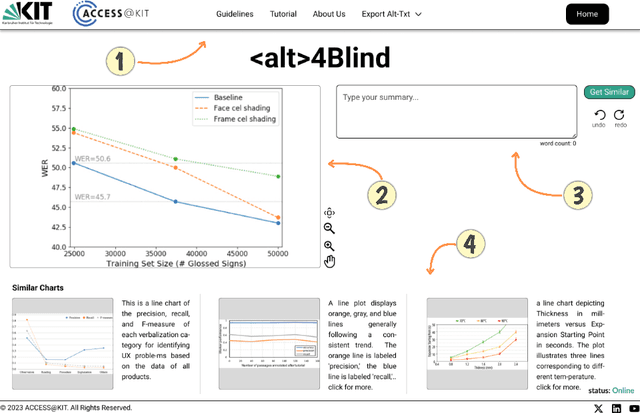
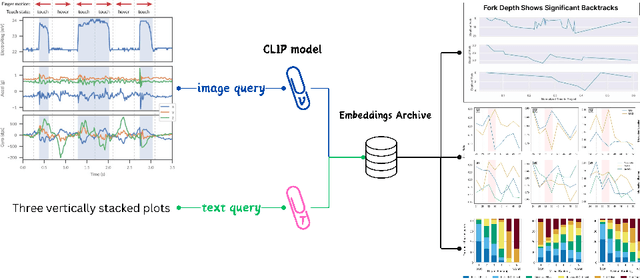
Abstract:Alternative Texts (Alt-Text) for chart images are essential for making graphics accessible to people with blindness and visual impairments. Traditionally, Alt-Text is manually written by authors but often encounters issues such as oversimplification or complication. Recent trends have seen the use of AI for Alt-Text generation. However, existing models are susceptible to producing inaccurate or misleading information. We address this challenge by retrieving high-quality alt-texts from similar chart images, serving as a reference for the user when creating alt-texts. Our three contributions are as follows: (1) we introduce a new benchmark comprising 5,000 real images with semantically labeled high-quality Alt-Texts, collected from Human Computer Interaction venues. (2) We developed a deep learning-based model to rank and retrieve similar chart images that share the same visual and textual semantics. (3) We designed a user interface (UI) to facilitate the alt-text creation process. Our preliminary interviews and investigations highlight the usability of our UI. For the dataset and further details, please refer to our project page: https://moured.github.io/alt4blind/.
ChartFormer: A Large Vision Language Model for Converting Chart Images into Tactile Accessible SVGs
May 29, 2024Abstract:Visualizations, such as charts, are crucial for interpreting complex data. However, they are often provided as raster images, which are not compatible with assistive technologies for people with blindness and visual impairments, such as embossed papers or tactile displays. At the same time, creating accessible vector graphics requires a skilled sighted person and is time-intensive. In this work, we leverage advancements in the field of chart analysis to generate tactile charts in an end-to-end manner. Our three key contributions are as follows: (1) introducing the ChartFormer model trained to convert raster chart images into tactile-accessible SVGs, (2) training this model on the Chart2Tactile dataset, a synthetic chart dataset we created following accessibility standards, and (3) evaluating the effectiveness of our SVGs through a pilot user study with an refreshable two-dimensional tactile display. Our work is publicly available at https://github.com/nsothman/ChartFormer .
ACCSAMS: Automatic Conversion of Exam Documents to Accessible Learning Material for Blind and Visually Impaired
May 29, 2024
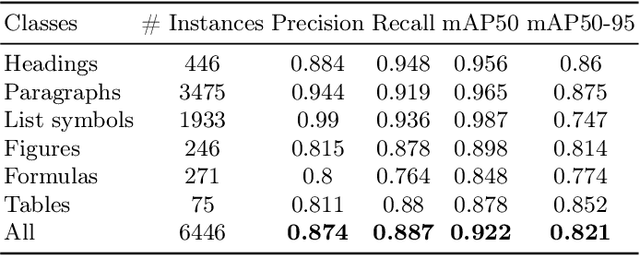
Abstract:Exam documents are essential educational materials for exam preparation. However, they pose a significant academic barrier for blind and visually impaired students, as they are often created without accessibility considerations. Typically, these documents are incompatible with screen readers, contain excessive white space, and lack alternative text for visual elements. This situation frequently requires intervention by experienced sighted individuals to modify the format and content for accessibility. We propose ACCSAMS, a semi-automatic system designed to enhance the accessibility of exam documents. Our system offers three key contributions: (1) creating an accessible layout and removing unnecessary white space, (2) adding navigational structures, and (3) incorporating alternative text for visual elements that were previously missing. Additionally, we present the first multilingual manually annotated dataset, comprising 1,293 German and 900 English exam documents which could serve as a good training source for deep learning models.
Line Graphics Digitization: A Step Towards Full Automation
Jul 05, 2023Abstract:The digitization of documents allows for wider accessibility and reproducibility. While automatic digitization of document layout and text content has been a long-standing focus of research, this problem in regard to graphical elements, such as statistical plots, has been under-explored. In this paper, we introduce the task of fine-grained visual understanding of mathematical graphics and present the Line Graphics (LG) dataset, which includes pixel-wise annotations of 5 coarse and 10 fine-grained categories. Our dataset covers 520 images of mathematical graphics collected from 450 documents from different disciplines. Our proposed dataset can support two different computer vision tasks, i.e., semantic segmentation and object detection. To benchmark our LG dataset, we explore 7 state-of-the-art models. To foster further research on the digitization of statistical graphs, we will make the dataset, code, and models publicly available to the community.
Towards Automatic Parsing of Structured Visual Content through the Use of Synthetic Data
Apr 29, 2022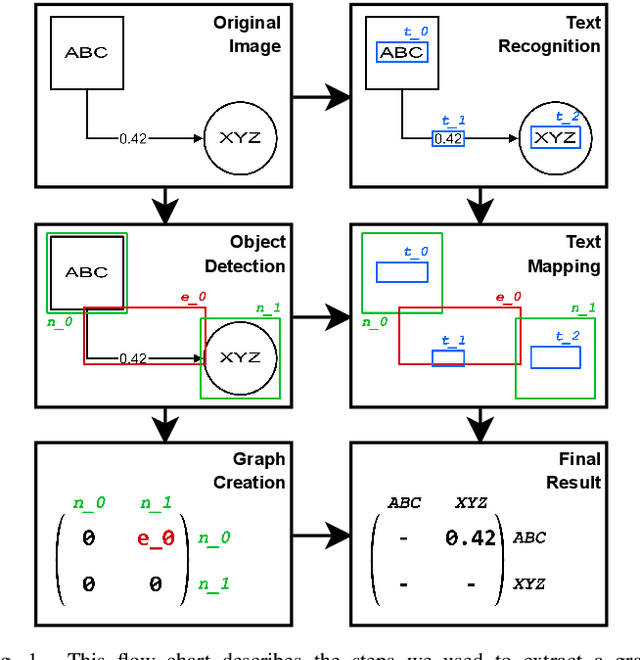
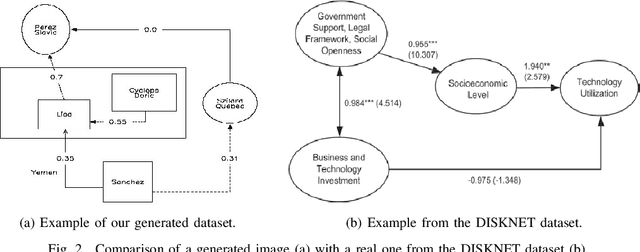
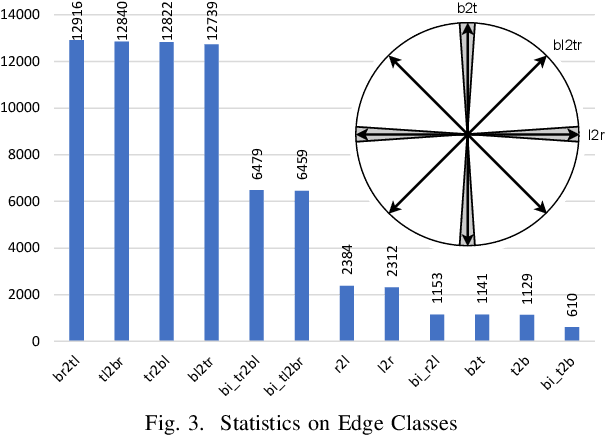

Abstract:Structured Visual Content (SVC) such as graphs, flow charts, or the like are used by authors to illustrate various concepts. While such depictions allow the average reader to better understand the contents, images containing SVCs are typically not machine-readable. This, in turn, not only hinders automated knowledge aggregation, but also the perception of displayed in-formation for visually impaired people. In this work, we propose a synthetic dataset, containing SVCs in the form of images as well as ground truths. We show the usage of this dataset by an application that automatically extracts a graph representation from an SVC image. This is done by training a model via common supervised learning methods. As there currently exist no large-scale public datasets for the detailed analysis of SVC, we propose the Synthetic SVC (SSVC) dataset comprising 12,000 images with respective bounding box annotations and detailed graph representations. Our dataset enables the development of strong models for the interpretation of SVCs while skipping the time-consuming dense data annotation. We evaluate our model on both synthetic and manually annotated data and show the transferability of synthetic to real via various metrics, given the presented application. Here, we evaluate that this proof of concept is possible to some extend and lay down a solid baseline for this task. We discuss the limitations of our approach for further improvements. Our utilized metrics can be used as a tool for future comparisons in this domain. To enable further research on this task, the dataset is publicly available at https://bit.ly/3jN1pJJ
 Add to Chrome
 Add to Firefox
 Add to Edge