Michaela Hardt
The PetShop Dataset -- Finding Causes of Performance Issues across Microservices
Nov 08, 2023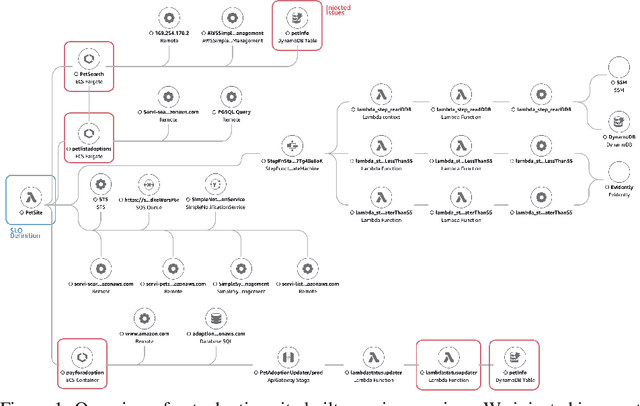
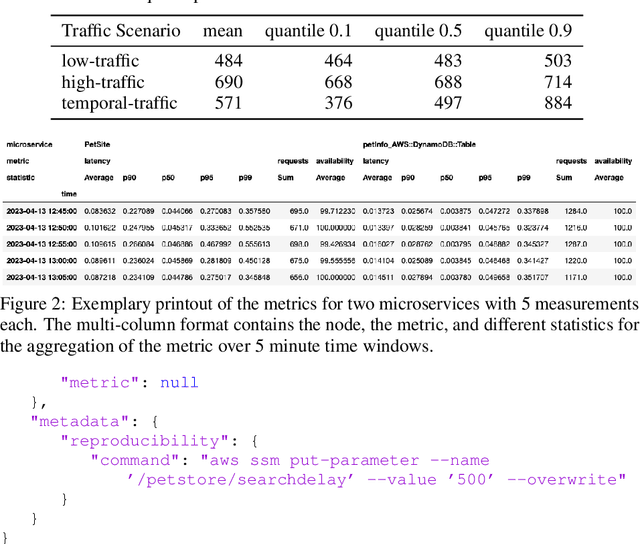
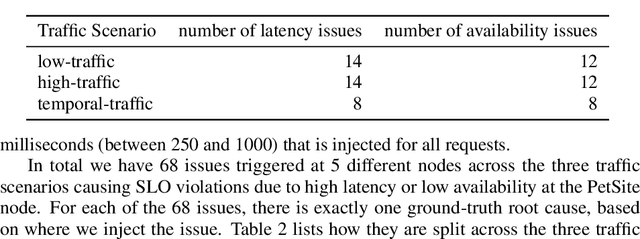
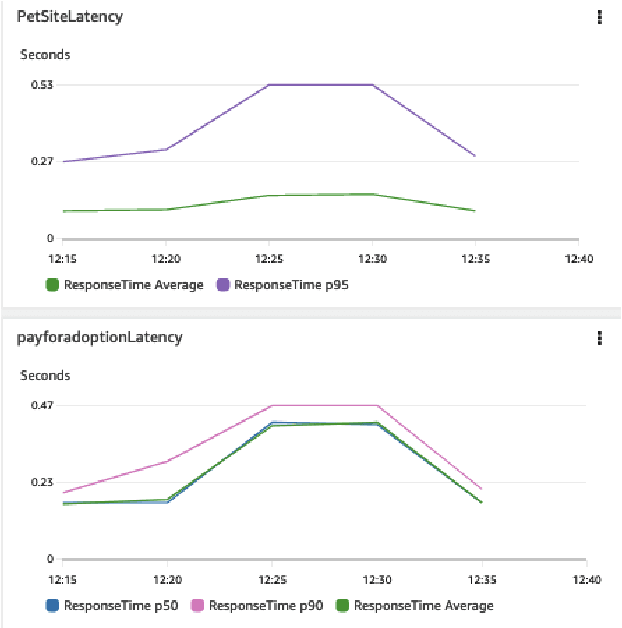
Abstract:Identifying root causes for unexpected or undesirable behavior in complex systems is a prevalent challenge. This issue becomes especially crucial in modern cloud applications that employ numerous microservices. Although the machine learning and systems research communities have proposed various techniques to tackle this problem, there is currently a lack of standardized datasets for quantitative benchmarking. Consequently, research groups are compelled to create their own datasets for experimentation. This paper introduces a dataset specifically designed for evaluating root cause analyses in microservice-based applications. The dataset encompasses latency, requests, and availability metrics emitted in 5-minute intervals from a distributed application. In addition to normal operation metrics, the dataset includes 68 injected performance issues, which increase latency and reduce availability throughout the system. We showcase how this dataset can be used to evaluate the accuracy of a variety of methods spanning different causal and non-causal characterisations of the root cause analysis problem. We hope the new dataset, available at https://github.com/amazon-science/petshop-root-cause-analysis/ enables further development of techniques in this important area.
Toward Falsifying Causal Graphs Using a Permutation-Based Test
May 16, 2023

Abstract:Understanding the causal relationships among the variables of a system is paramount to explain and control its behaviour. Inferring the causal graph from observational data without interventions, however, requires a lot of strong assumptions that are not always realistic. Even for domain experts it can be challenging to express the causal graph. Therefore, metrics that quantitatively assess the goodness of a causal graph provide helpful checks before using it in downstream tasks. Existing metrics provide an absolute number of inconsistencies between the graph and the observed data, and without a baseline, practitioners are left to answer the hard question of how many such inconsistencies are acceptable or expected. Here, we propose a novel consistency metric by constructing a surrogate baseline through node permutations. By comparing the number of inconsistencies with those on the surrogate baseline, we derive an interpretable metric that captures whether the DAG fits significantly better than random. Evaluating on both simulated and real data sets from various domains, including biology and cloud monitoring, we demonstrate that the true DAG is not falsified by our metric, whereas the wrong graphs given by a hypothetical user are likely to be falsified.
Amazon SageMaker Clarify: Machine Learning Bias Detection and Explainability in the Cloud
Sep 07, 2021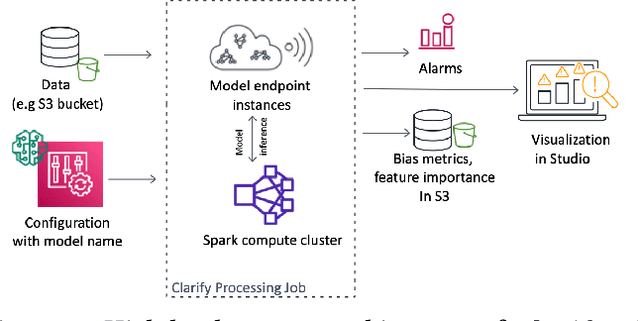

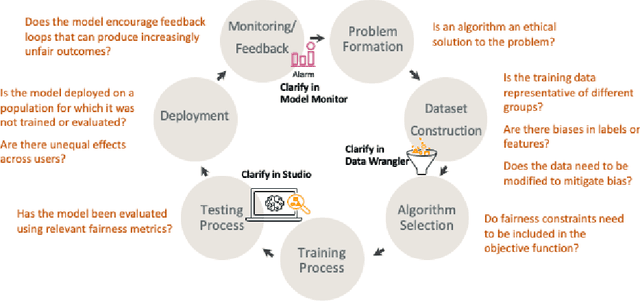

Abstract:Understanding the predictions made by machine learning (ML) models and their potential biases remains a challenging and labor-intensive task that depends on the application, the dataset, and the specific model. We present Amazon SageMaker Clarify, an explainability feature for Amazon SageMaker that launched in December 2020, providing insights into data and ML models by identifying biases and explaining predictions. It is deeply integrated into Amazon SageMaker, a fully managed service that enables data scientists and developers to build, train, and deploy ML models at any scale. Clarify supports bias detection and feature importance computation across the ML lifecycle, during data preparation, model evaluation, and post-deployment monitoring. We outline the desiderata derived from customer input, the modular architecture, and the methodology for bias and explanation computations. Further, we describe the technical challenges encountered and the tradeoffs we had to make. For illustration, we discuss two customer use cases. We present our deployment results including qualitative customer feedback and a quantitative evaluation. Finally, we summarize lessons learned, and discuss best practices for the successful adoption of fairness and explanation tools in practice.
Linear Dynamics: Clustering without identification
Sep 02, 2019
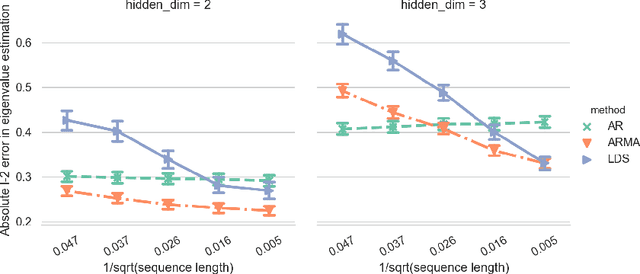

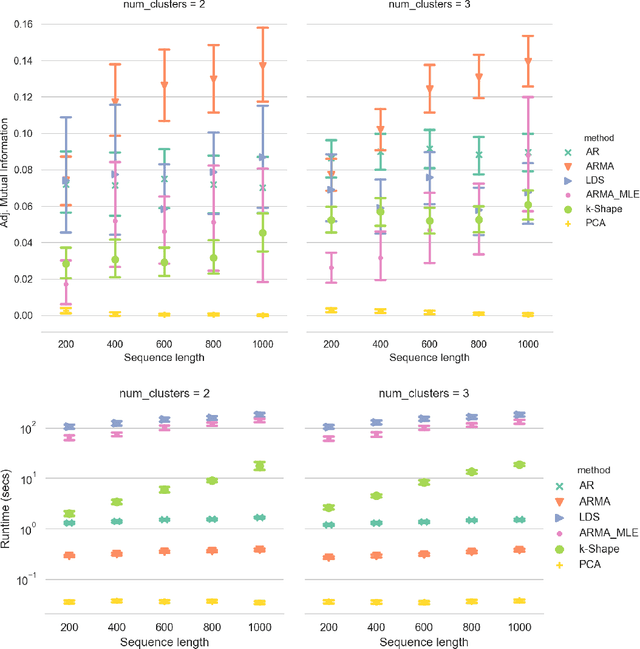
Abstract:Clustering time series is a delicate task; varying lengths and temporal offsets obscure direct comparisons. A natural strategy is to learn a parametric model foreach time series and to cluster the model parameters rather than the sequences themselves. Linear dynamical systems are a fundamental and powerful parametric model class. However, identifying the parameters of a linear dynamical systems is a venerable task, permitting provably efficient solutions only in special cases. In this work, we show that clustering the parameters of unknown linear dynamical systems is, in fact, easier than identifying them. We analyze a computationally efficient clustering algorithm that enjoys provable convergence guarantees under a natural separation assumption. Although easy to implement, our algorithm is general, handling multi-dimensional data with time offsets and partial sequences. Evaluating our algorithm on both synthetic data and real electrocardiogram (ECG) signals, we see significant improvements in clustering quality over existing baselines.
Explaining an increase in predicted risk for clinical alerts
Jul 10, 2019
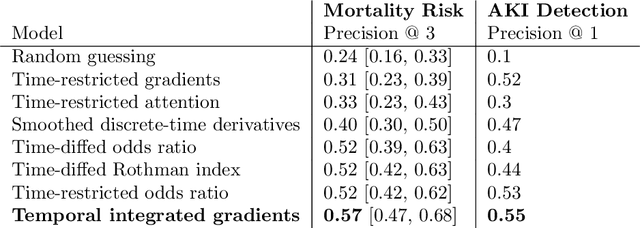

Abstract:Much work aims to explain a model's prediction on a static input. We consider explanations in a temporal setting where a stateful dynamical model produces a sequence of risk estimates given an input at each time step. When the estimated risk increases, the goal of the explanation is to attribute the increase to a few relevant inputs from the past. While our formal setup and techniques are general, we carry out an in-depth case study in a clinical setting. The goal here is to alert a clinician when a patient's risk of deterioration rises. The clinician then has to decide whether to intervene and adjust the treatment. Given a potentially long sequence of new events since she last saw the patient, a concise explanation helps her to quickly triage the alert. We develop methods to lift static attribution techniques to the dynamical setting, where we identify and address challenges specific to dynamics. We then experimentally assess the utility of different explanations of clinical alerts through expert evaluation.
Scalable and accurate deep learning for electronic health records
May 11, 2018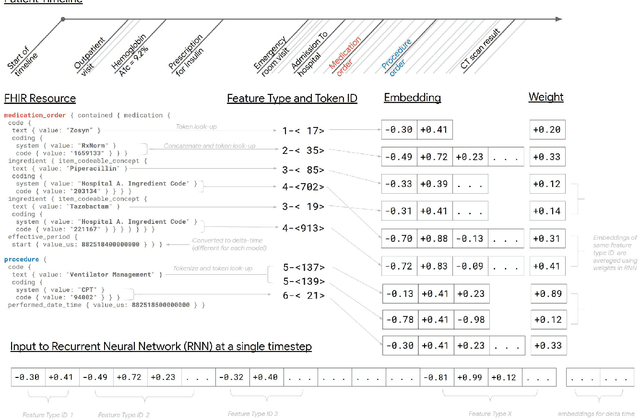
Abstract:Predictive modeling with electronic health record (EHR) data is anticipated to drive personalized medicine and improve healthcare quality. Constructing predictive statistical models typically requires extraction of curated predictor variables from normalized EHR data, a labor-intensive process that discards the vast majority of information in each patient's record. We propose a representation of patients' entire, raw EHR records based on the Fast Healthcare Interoperability Resources (FHIR) format. We demonstrate that deep learning methods using this representation are capable of accurately predicting multiple medical events from multiple centers without site-specific data harmonization. We validated our approach using de-identified EHR data from two U.S. academic medical centers with 216,221 adult patients hospitalized for at least 24 hours. In the sequential format we propose, this volume of EHR data unrolled into a total of 46,864,534,945 data points, including clinical notes. Deep learning models achieved high accuracy for tasks such as predicting in-hospital mortality (AUROC across sites 0.93-0.94), 30-day unplanned readmission (AUROC 0.75-0.76), prolonged length of stay (AUROC 0.85-0.86), and all of a patient's final discharge diagnoses (frequency-weighted AUROC 0.90). These models outperformed state-of-the-art traditional predictive models in all cases. We also present a case-study of a neural-network attribution system, which illustrates how clinicians can gain some transparency into the predictions. We believe that this approach can be used to create accurate and scalable predictions for a variety of clinical scenarios, complete with explanations that directly highlight evidence in the patient's chart.
* Published version from https://www.nature.com/articles/s41746-018-0029-1
 Add to Chrome
 Add to Firefox
 Add to Edge