Enamul Hoque
School of Information Technology, York University
Aligning Text, Code, and Vision: A Multi-Objective Reinforcement Learning Framework for Text-to-Visualization
Jan 08, 2026Abstract:Text-to-Visualization (Text2Vis) systems translate natural language queries over tabular data into concise answers and executable visualizations. While closed-source LLMs generate functional code, the resulting charts often lack semantic alignment and clarity, qualities that can only be assessed post-execution. Open-source models struggle even more, frequently producing non-executable or visually poor outputs. Although supervised fine-tuning can improve code executability, it fails to enhance overall visualization quality, as traditional SFT loss cannot capture post-execution feedback. To address this gap, we propose RL-Text2Vis, the first reinforcement learning framework for Text2Vis generation. Built on Group Relative Policy Optimization (GRPO), our method uses a novel multi-objective reward that jointly optimizes textual accuracy, code validity, and visualization quality using post-execution feedback. By training Qwen2.5 models (7B and 14B), RL-Text2Vis achieves a 22% relative improvement in chart quality over GPT-4o on the Text2Vis benchmark and boosts code execution success from 78% to 97% relative to its zero-shot baseline. Our models significantly outperform strong zero-shot and supervised baselines and also demonstrate robust generalization to out-of-domain datasets like VIS-Eval and NVBench. These results establish GRPO as an effective strategy for structured, multimodal reasoning in visualization generation. We release our code at https://github.com/vis-nlp/RL-Text2Vis.
DashboardQA: Benchmarking Multimodal Agents for Question Answering on Interactive Dashboards
Aug 24, 2025Abstract:Dashboards are powerful visualization tools for data-driven decision-making, integrating multiple interactive views that allow users to explore, filter, and navigate data. Unlike static charts, dashboards support rich interactivity, which is essential for uncovering insights in real-world analytical workflows. However, existing question-answering benchmarks for data visualizations largely overlook this interactivity, focusing instead on static charts. This limitation severely constrains their ability to evaluate the capabilities of modern multimodal agents designed for GUI-based reasoning. To address this gap, we introduce DashboardQA, the first benchmark explicitly designed to assess how vision-language GUI agents comprehend and interact with real-world dashboards. The benchmark includes 112 interactive dashboards from Tableau Public and 405 question-answer pairs with interactive dashboards spanning five categories: multiple-choice, factoid, hypothetical, multi-dashboard, and conversational. By assessing a variety of leading closed- and open-source GUI agents, our analysis reveals their key limitations, particularly in grounding dashboard elements, planning interaction trajectories, and performing reasoning. Our findings indicate that interactive dashboard reasoning is a challenging task overall for all the VLMs evaluated. Even the top-performing agents struggle; for instance, the best agent based on Gemini-Pro-2.5 achieves only 38.69% accuracy, while the OpenAI CUA agent reaches just 22.69%, demonstrating the benchmark's significant difficulty. We release DashboardQA at https://github.com/vis-nlp/DashboardQA
Judging the Judges: Can Large Vision-Language Models Fairly Evaluate Chart Comprehension and Reasoning?
May 13, 2025Abstract:Charts are ubiquitous as they help people understand and reason with data. Recently, various downstream tasks, such as chart question answering, chart2text, and fact-checking, have emerged. Large Vision-Language Models (LVLMs) show promise in tackling these tasks, but their evaluation is costly and time-consuming, limiting real-world deployment. While using LVLMs as judges to assess the chart comprehension capabilities of other LVLMs could streamline evaluation processes, challenges like proprietary datasets, restricted access to powerful models, and evaluation costs hinder their adoption in industrial settings. To this end, we present a comprehensive evaluation of 13 open-source LVLMs as judges for diverse chart comprehension and reasoning tasks. We design both pairwise and pointwise evaluation tasks covering criteria like factual correctness, informativeness, and relevancy. Additionally, we analyze LVLM judges based on format adherence, positional consistency, length bias, and instruction-following. We focus on cost-effective LVLMs (<10B parameters) suitable for both research and commercial use, following a standardized evaluation protocol and rubric to measure the LVLM judge's accuracy. Experimental results reveal notable variability: while some open LVLM judges achieve GPT-4-level evaluation performance (about 80% agreement with GPT-4 judgments), others struggle (below ~10% agreement). Our findings highlight that state-of-the-art open-source LVLMs can serve as cost-effective automatic evaluators for chart-related tasks, though biases such as positional preference and length bias persist.
ChartQAPro: A More Diverse and Challenging Benchmark for Chart Question Answering
Apr 10, 2025Abstract:Charts are ubiquitous, as people often use them to analyze data, answer questions, and discover critical insights. However, performing complex analytical tasks with charts requires significant perceptual and cognitive effort. Chart Question Answering (CQA) systems automate this process by enabling models to interpret and reason with visual representations of data. However, existing benchmarks like ChartQA lack real-world diversity and have recently shown performance saturation with modern large vision-language models (LVLMs). To address these limitations, we introduce ChartQAPro, a new benchmark that includes 1,341 charts from 157 diverse sources, spanning various chart types, including infographics and dashboards, and featuring 1,948 questions in various types, such as multiple-choice, conversational, hypothetical, and unanswerable questions, to better reflect real-world challenges. Our evaluations with 21 models show a substantial performance drop for LVLMs on ChartQAPro; e.g., Claude Sonnet 3.5 scores 90.5% on ChartQA but only 55.81% on ChartQAPro, underscoring the complexity of chart reasoning. We complement our findings with detailed error analyses and ablation studies, identifying key challenges and opportunities for advancing LVLMs in chart understanding and reasoning. We release ChartQAPro at https://github.com/vis-nlp/ChartQAPro.
AlignVLM: Bridging Vision and Language Latent Spaces for Multimodal Understanding
Feb 03, 2025


Abstract:Aligning visual features with language embeddings is a key challenge in vision-language models (VLMs). The performance of such models hinges on having a good connector that maps visual features generated by a vision encoder to a shared embedding space with the LLM while preserving semantic similarity. Existing connectors, such as multilayer perceptrons (MLPs), often produce out-of-distribution or noisy inputs, leading to misalignment between the modalities. In this work, we propose a novel vision-text alignment method, AlignVLM, that maps visual features to a weighted average of LLM text embeddings. Our approach leverages the linguistic priors encoded by the LLM to ensure that visual features are mapped to regions of the space that the LLM can effectively interpret. AlignVLM is particularly effective for document understanding tasks, where scanned document images must be accurately mapped to their textual content. Our extensive experiments show that AlignVLM achieves state-of-the-art performance compared to prior alignment methods. We provide further analysis demonstrating improved vision-text feature alignment and robustness to noise.
Open-RAG: Enhanced Retrieval-Augmented Reasoning with Open-Source Large Language Models
Oct 02, 2024


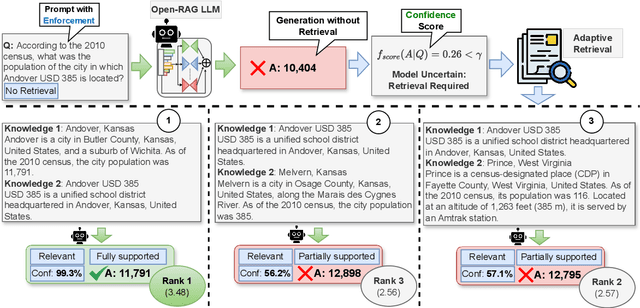
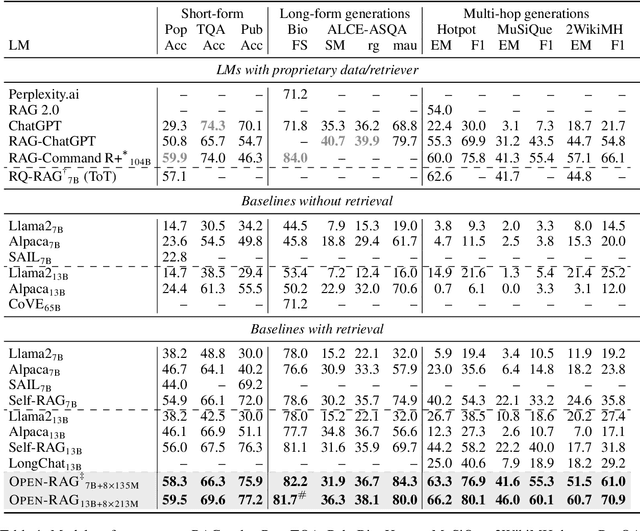
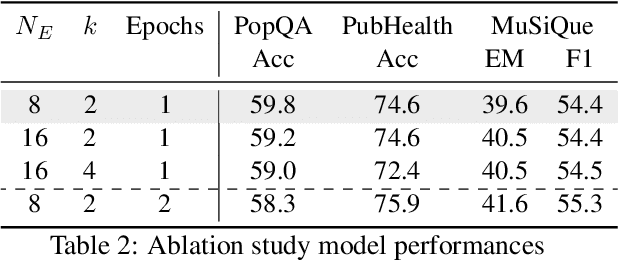
Abstract:Retrieval-Augmented Generation (RAG) has been shown to enhance the factual accuracy of Large Language Models (LLMs), but existing methods often suffer from limited reasoning capabilities in effectively using the retrieved evidence, particularly when using open-source LLMs. To mitigate this gap, we introduce a novel framework, Open-RAG, designed to enhance reasoning capabilities in RAG with open-source LLMs. Our framework transforms an arbitrary dense LLM into a parameter-efficient sparse mixture of experts (MoE) model capable of handling complex reasoning tasks, including both single- and multi-hop queries. Open-RAG uniquely trains the model to navigate challenging distractors that appear relevant but are misleading. As a result, Open-RAG leverages latent learning, dynamically selecting relevant experts and integrating external knowledge effectively for more accurate and contextually relevant responses. In addition, we propose a hybrid adaptive retrieval method to determine retrieval necessity and balance the trade-off between performance gain and inference speed. Experimental results show that the Llama2-7B-based Open-RAG outperforms state-of-the-art LLMs and RAG models such as ChatGPT, Self-RAG, and Command R+ in various knowledge-intensive tasks. We open-source our code and models at https://openragmoe.github.io/
Natural Language Generation for Visualizations: State of the Art, Challenges and Future Directions
Sep 29, 2024Abstract:Natural language and visualization are two complementary modalities of human communication that play a crucial role in conveying information effectively. While visualizations help people discover trends, patterns, and anomalies in data, natural language descriptions help explain these insights. Thus, combining text with visualizations is a prevalent technique for effectively delivering the core message of the data. Given the rise of natural language generation (NLG), there is a growing interest in automatically creating natural language descriptions for visualizations, which can be used as chart captions, answering questions about charts, or telling data-driven stories. In this survey, we systematically review the state of the art on NLG for visualizations and introduce a taxonomy of the problem. The NLG tasks fall within the domain of Natural Language Interfaces (NLI) for visualization, an area that has garnered significant attention from both the research community and industry. To narrow down the scope of the survey, we primarily concentrate on the research works that focus on text generation for visualizations. To characterize the NLG problem and the design space of proposed solutions, we pose five Wh-questions, why and how NLG tasks are performed for visualizations, what the task inputs and outputs are, as well as where and when the generated texts are integrated with visualizations. We categorize the solutions used in the surveyed papers based on these "five Wh-questions." Finally, we discuss the key challenges and potential avenues for future research in this domain.
DataNarrative: Automated Data-Driven Storytelling with Visualizations and Texts
Aug 13, 2024


Abstract:Data-driven storytelling is a powerful method for conveying insights by combining narrative techniques with visualizations and text. These stories integrate visual aids, such as highlighted bars and lines in charts, along with textual annotations explaining insights. However, creating such stories requires a deep understanding of the data and meticulous narrative planning, often necessitating human intervention, which can be time-consuming and mentally taxing. While Large Language Models (LLMs) excel in various NLP tasks, their ability to generate coherent and comprehensive data stories remains underexplored. In this work, we introduce a novel task for data story generation and a benchmark containing 1,449 stories from diverse sources. To address the challenges of crafting coherent data stories, we propose a multiagent framework employing two LLM agents designed to replicate the human storytelling process: one for understanding and describing the data (Reflection), generating the outline, and narration, and another for verification at each intermediary step. While our agentic framework generally outperforms non-agentic counterparts in both model-based and human evaluations, the results also reveal unique challenges in data story generation.
A Systematic Survey and Critical Review on Evaluating Large Language Models: Challenges, Limitations, and Recommendations
Jul 04, 2024


Abstract:Large Language Models (LLMs) have recently gained significant attention due to their remarkable capabilities in performing diverse tasks across various domains. However, a thorough evaluation of these models is crucial before deploying them in real-world applications to ensure they produce reliable performance. Despite the well-established importance of evaluating LLMs in the community, the complexity of the evaluation process has led to varied evaluation setups, causing inconsistencies in findings and interpretations. To address this, we systematically review the primary challenges and limitations causing these inconsistencies and unreliable evaluations in various steps of LLM evaluation. Based on our critical review, we present our perspectives and recommendations to ensure LLM evaluations are reproducible, reliable, and robust.
ChartGemma: Visual Instruction-tuning for Chart Reasoning in the Wild
Jul 04, 2024


Abstract:Given the ubiquity of charts as a data analysis, visualization, and decision-making tool across industries and sciences, there has been a growing interest in developing pre-trained foundation models as well as general purpose instruction-tuned models for chart understanding and reasoning. However, existing methods suffer crucial drawbacks across two critical axes affecting the performance of chart representation models: they are trained on data generated from underlying data tables of the charts, ignoring the visual trends and patterns in chart images, and use weakly aligned vision-language backbone models for domain-specific training, limiting their generalizability when encountering charts in the wild. We address these important drawbacks and introduce ChartGemma, a novel chart understanding and reasoning model developed over PaliGemma. Rather than relying on underlying data tables, ChartGemma is trained on instruction-tuning data generated directly from chart images, thus capturing both high-level trends and low-level visual information from a diverse set of charts. Our simple approach achieves state-of-the-art results across $5$ benchmarks spanning chart summarization, question answering, and fact-checking, and our elaborate qualitative studies on real-world charts show that ChartGemma generates more realistic and factually correct summaries compared to its contemporaries. We release the code, model checkpoints, dataset, and demos at https://github.com/vis-nlp/ChartGemma.
 Add to Chrome
 Add to Firefox
 Add to Edge