Are Large Vision Language Models up to the Challenge of Chart Comprehension and Reasoning? An Extensive Investigation into the Capabilities and Limitations of LVLMs
Paper and Code
Jun 01, 2024


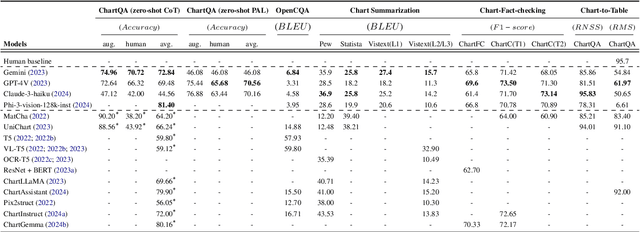
Natural language is a powerful complementary modality of communication for data visualizations, such as bar and line charts. To facilitate chart-based reasoning using natural language, various downstream tasks have been introduced recently such as chart question answering, chart summarization, and fact-checking with charts. These tasks pose a unique challenge, demanding both vision-language reasoning and a nuanced understanding of chart data tables, visual encodings, and natural language prompts. Despite the recent success of Large Language Models (LLMs) across diverse NLP tasks, their abilities and limitations in the realm of data visualization remain under-explored, possibly due to their lack of multi-modal capabilities. To bridge the gap, this paper presents the first comprehensive evaluation of the recently developed large vision language models (LVLMs) for chart understanding and reasoning tasks. Our evaluation includes a comprehensive assessment of LVLMs, including GPT-4V and Gemini, across four major chart reasoning tasks. Furthermore, we perform a qualitative evaluation of LVLMs' performance on a diverse range of charts, aiming to provide a thorough analysis of their strengths and weaknesses. Our findings reveal that LVLMs demonstrate impressive abilities in generating fluent texts covering high-level data insights while also encountering common problems like hallucinations, factual errors, and data bias. We highlight the key strengths and limitations of chart comprehension tasks, offering insights for future research.
 Add to Chrome
 Add to Firefox
 Add to Edge