Raian Rahman
Are Large Vision Language Models up to the Challenge of Chart Comprehension and Reasoning? An Extensive Investigation into the Capabilities and Limitations of LVLMs
Jun 01, 2024


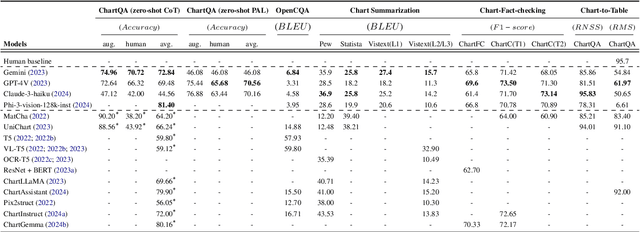
Abstract:Natural language is a powerful complementary modality of communication for data visualizations, such as bar and line charts. To facilitate chart-based reasoning using natural language, various downstream tasks have been introduced recently such as chart question answering, chart summarization, and fact-checking with charts. These tasks pose a unique challenge, demanding both vision-language reasoning and a nuanced understanding of chart data tables, visual encodings, and natural language prompts. Despite the recent success of Large Language Models (LLMs) across diverse NLP tasks, their abilities and limitations in the realm of data visualization remain under-explored, possibly due to their lack of multi-modal capabilities. To bridge the gap, this paper presents the first comprehensive evaluation of the recently developed large vision language models (LVLMs) for chart understanding and reasoning tasks. Our evaluation includes a comprehensive assessment of LVLMs, including GPT-4V and Gemini, across four major chart reasoning tasks. Furthermore, we perform a qualitative evaluation of LVLMs' performance on a diverse range of charts, aiming to provide a thorough analysis of their strengths and weaknesses. Our findings reveal that LVLMs demonstrate impressive abilities in generating fluent texts covering high-level data insights while also encountering common problems like hallucinations, factual errors, and data bias. We highlight the key strengths and limitations of chart comprehension tasks, offering insights for future research.
ChartSumm: A Comprehensive Benchmark for Automatic Chart Summarization of Long and Short Summaries
Apr 29, 2023Abstract:Automatic chart to text summarization is an effective tool for the visually impaired people along with providing precise insights of tabular data in natural language to the user. A large and well-structured dataset is always a key part for data driven models. In this paper, we propose ChartSumm: a large-scale benchmark dataset consisting of a total of 84,363 charts along with their metadata and descriptions covering a wide range of topics and chart types to generate short and long summaries. Extensive experiments with strong baseline models show that even though these models generate fluent and informative summaries by achieving decent scores in various automatic evaluation metrics, they often face issues like suffering from hallucination, missing out important data points, in addition to incorrect explanation of complex trends in the charts. We also investigated the potential of expanding ChartSumm to other languages using automated translation tools. These make our dataset a challenging benchmark for future research.
Densely-Populated Traffic Detection using YOLOv5 and Non-Maximum Suppression Ensembling
Aug 27, 2021Abstract:Vehicular object detection is the heart of any intelligent traffic system. It is essential for urban traffic management. R-CNN, Fast R-CNN, Faster R-CNN and YOLO were some of the earlier state-of-the-art models. Region based CNN methods have the problem of higher inference time which makes it unrealistic to use the model in real-time. YOLO on the other hand struggles to detect small objects that appear in groups. In this paper, we propose a method that can locate and classify vehicular objects from a given densely crowded image using YOLOv5. The shortcoming of YOLO was solved my ensembling 4 different models. Our proposed model performs well on images taken from both top view and side view of the street in both day and night. The performance of our proposed model was measured on Dhaka AI dataset which contains densely crowded vehicular images. Our experiment shows that our model achieved mAP@0.5 of 0.458 with inference time of 0.75 sec which outperforms other state-of-the-art models on performance. Hence, the model can be implemented in the street for real-time traffic detection which can be used for traffic control and data collection.
 Add to Chrome
 Add to Firefox
 Add to Edge