Anthony Ortiz
Optimizing Cloud-to-GPU Throughput for Deep Learning With Earth Observation Data
Jun 06, 2025Abstract:Training deep learning models on petabyte-scale Earth observation (EO) data requires separating compute resources from data storage. However, standard PyTorch data loaders cannot keep modern GPUs utilized when streaming GeoTIFF files directly from cloud storage. In this work, we benchmark GeoTIFF loading throughput from both cloud object storage and local SSD, systematically testing different loader configurations and data parameters. We focus on tile-aligned reads and worker thread pools, using Bayesian optimization to find optimal settings for each storage type. Our optimized configurations increase remote data loading throughput by 20x and local throughput by 4x compared to default settings. On three public EO benchmarks, models trained with optimized remote loading achieve the same accuracy as local training within identical time budgets. We improve validation IoU by 6-15% and maintain 85-95% GPU utilization versus 0-30% with standard configurations. Code is publicly available at https://github.com/microsoft/pytorch-cloud-geotiff-optimization
Core-Set Selection for Data-efficient Land Cover Segmentation
May 02, 2025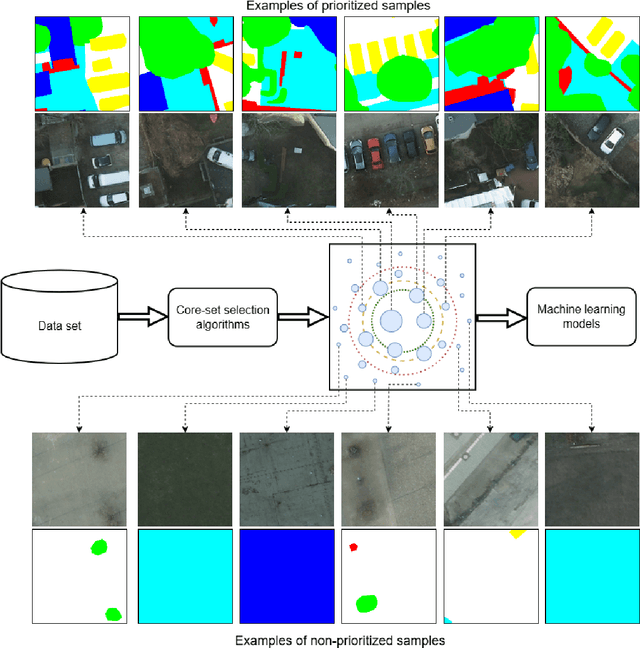
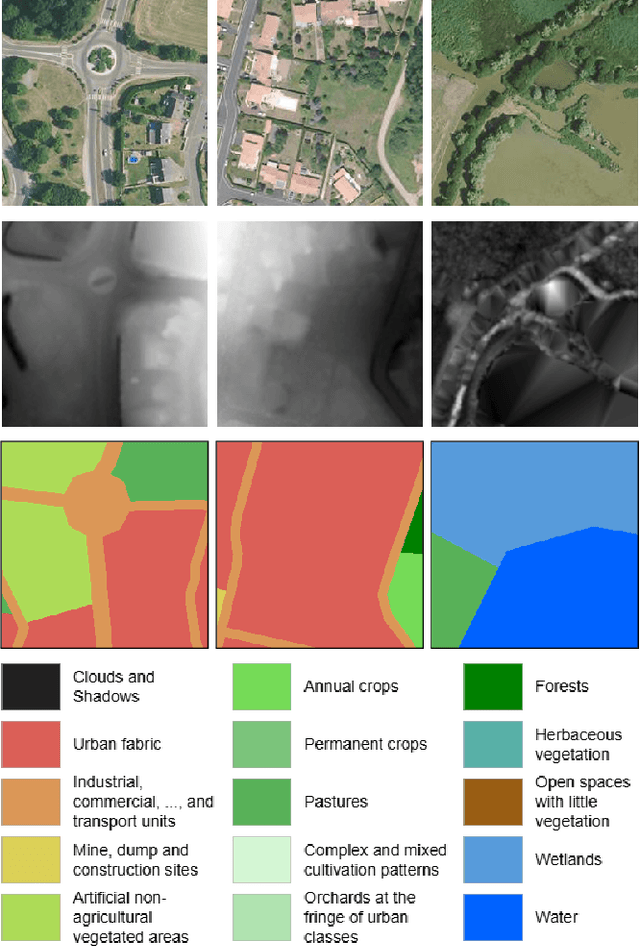
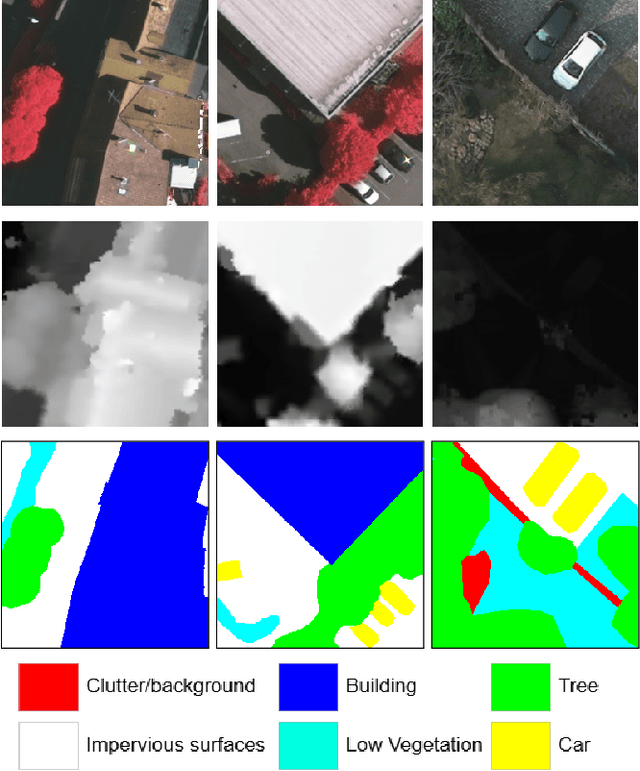

Abstract:The increasing accessibility of remotely sensed data and the potential of such data to inform large-scale decision-making has driven the development of deep learning models for many Earth Observation tasks. Traditionally, such models must be trained on large datasets. However, the common assumption that broadly larger datasets lead to better outcomes tends to overlook the complexities of the data distribution, the potential for introducing biases and noise, and the computational resources required for processing and storing vast datasets. Therefore, effective solutions should consider both the quantity and quality of data. In this paper, we propose six novel core-set selection methods for selecting important subsets of samples from remote sensing image segmentation datasets that rely on imagery only, labels only, and a combination of each. We benchmark these approaches against a random-selection baseline on three commonly used land cover classification datasets: DFC2022, Vaihingen, and Potsdam. In each of the datasets, we demonstrate that training on a subset of samples outperforms the random baseline, and some approaches outperform training on all available data. This result shows the importance and potential of data-centric learning for the remote sensing domain. The code is available at https://github.com/keillernogueira/data-centric-rs-classification/.
Global Renewables Watch: A Temporal Dataset of Solar and Wind Energy Derived from Satellite Imagery
Mar 19, 2025Abstract:We present a comprehensive global temporal dataset of commercial solar photovoltaic (PV) farms and onshore wind turbines, derived from high-resolution satellite imagery analyzed quarterly from the fourth quarter of 2017 to the second quarter of 2024. We create this dataset by training deep learning-based segmentation models to identify these renewable energy installations from satellite imagery, then deploy them on over 13 trillion pixels covering the world. For each detected feature, we estimate the construction date and the preceding land use type. This dataset offers crucial insights into progress toward sustainable development goals and serves as a valuable resource for policymakers, researchers, and stakeholders aiming to assess and promote effective strategies for renewable energy deployment. Our final spatial dataset includes 375,197 individual wind turbines and 86,410 solar PV installations. We aggregate our predictions to the country level -- estimating total power capacity based on construction date, solar PV area, and number of windmills -- and find an $r^2$ value of $0.96$ and $0.93$ for solar PV and onshore wind respectively compared to IRENA's most recent 2023 country-level capacity estimates.
FLAVARS: A Multimodal Foundational Language and Vision Alignment Model for Remote Sensing
Jan 14, 2025


Abstract:Remote sensing imagery is dense with objects and contextual visual information. There is a recent trend to combine paired satellite images and text captions for pretraining performant encoders for downstream tasks. However, while contrastive image-text methods like CLIP enable vision-language alignment and zero-shot classification ability, vision-only downstream performance tends to degrade compared to image-only pretraining, such as MAE. In this paper, we propose FLAVARS, a pretraining method that combines the best of both contrastive learning and masked modeling, along with geospatial alignment via contrastive location encoding. We find that FLAVARS significantly outperforms a baseline of SkyCLIP for vision-only tasks such as KNN classification and semantic segmentation, +6\% mIOU on SpaceNet1, while retaining the ability to perform zero-shot classification, unlike MAE pretrained methods.
PGRID: Power Grid Reconstruction in Informal Developments Using High-Resolution Aerial Imagery
Dec 10, 2024


Abstract:As of 2023, a record 117 million people have been displaced worldwide, more than double the number from a decade ago [22]. Of these, 32 million are refugees under the UNHCR mandate, with 8.7 million residing in refugee camps. A critical issue faced by these populations is the lack of access to electricity, with 80% of the 8.7 million refugees and displaced persons in camps globally relying on traditional biomass for cooking and lacking reliable power for essential tasks such as cooking and charging phones. Often, the burden of collecting firewood falls on women and children, who frequently travel up to 20 kilometers into dangerous areas, increasing their vulnerability.[7] Electricity access could significantly alleviate these challenges, but a major obstacle is the lack of accurate power grid infrastructure maps, particularly in resource-constrained environments like refugee camps, needed for energy access planning. Existing power grid maps are often outdated, incomplete, or dependent on costly, complex technologies, limiting their practicality. To address this issue, PGRID is a novel application-based approach, which utilizes high-resolution aerial imagery to detect electrical poles and segment electrical lines, creating precise power grid maps. PGRID was tested in the Turkana region of Kenya, specifically the Kakuma and Kalobeyei Camps, covering 84 km2 and housing over 200,000 residents. Our findings show that PGRID delivers high-fidelity power grid maps especially in unplanned settlements, with F1-scores of 0.71 and 0.82 for pole detection and line segmentation, respectively. This study highlights a practical application for leveraging open data and limited labels to improve power grid mapping in unplanned settlements, where the growing number of displaced persons urgently need sustainable energy infrastructure solutions.
A Change Detection Reality Check
Feb 10, 2024

Abstract:In recent years, there has been an explosion of proposed change detection deep learning architectures in the remote sensing literature. These approaches claim to offer state-of the-art performance on different standard benchmark datasets. However, has the field truly made significant progress? In this paper we perform experiments which conclude a simple U-Net segmentation baseline without training tricks or complicated architectural changes is still a top performer for the task of change detection.
Seeing the roads through the trees: A benchmark for modeling spatial dependencies with aerial imagery
Jan 12, 2024Abstract:Fully understanding a complex high-resolution satellite or aerial imagery scene often requires spatial reasoning over a broad relevant context. The human object recognition system is able to understand object in a scene over a long-range relevant context. For example, if a human observes an aerial scene that shows sections of road broken up by tree canopy, then they will be unlikely to conclude that the road has actually been broken up into disjoint pieces by trees and instead think that the canopy of nearby trees is occluding the road. However, there is limited research being conducted to understand long-range context understanding of modern machine learning models. In this work we propose a road segmentation benchmark dataset, Chesapeake Roads Spatial Context (RSC), for evaluating the spatial long-range context understanding of geospatial machine learning models and show how commonly used semantic segmentation models can fail at this task. For example, we show that a U-Net trained to segment roads from background in aerial imagery achieves an 84% recall on unoccluded roads, but just 63.5% recall on roads covered by tree canopy despite being trained to model both the same way. We further analyze how the performance of models changes as the relevant context for a decision (unoccluded roads in our case) varies in distance. We release the code to reproduce our experiments and dataset of imagery and masks to encourage future research in this direction -- https://github.com/isaaccorley/ChesapeakeRSC.
Poverty rate prediction using multi-modal survey and earth observation data
Jul 21, 2023


Abstract:This work presents an approach for combining household demographic and living standards survey questions with features derived from satellite imagery to predict the poverty rate of a region. Our approach utilizes visual features obtained from a single-step featurization method applied to freely available 10m/px Sentinel-2 surface reflectance satellite imagery. These visual features are combined with ten survey questions in a proxy means test (PMT) to estimate whether a household is below the poverty line. We show that the inclusion of visual features reduces the mean error in poverty rate estimates from 4.09% to 3.88% over a nationally representative out-of-sample test set. In addition to including satellite imagery features in proxy means tests, we propose an approach for selecting a subset of survey questions that are complementary to the visual features extracted from satellite imagery. Specifically, we design a survey variable selection approach guided by the full survey and image features and use the approach to determine the most relevant set of small survey questions to include in a PMT. We validate the choice of small survey questions in a downstream task of predicting the poverty rate using the small set of questions. This approach results in the best performance -- errors in poverty rate decrease from 4.09% to 3.71%. We show that extracted visual features encode geographic and urbanization differences between regions.
Rapid building damage assessment workflow: An implementation for the 2023 Rolling Fork, Mississippi tornado event
Jun 21, 2023


Abstract:Rapid and accurate building damage assessments from high-resolution satellite imagery following a natural disaster is essential to inform and optimize first responder efforts. However, performing such building damage assessments in an automated manner is non-trivial due to the challenges posed by variations in disaster-specific damage, diversity in satellite imagery, and the dearth of extensive, labeled datasets. To circumvent these issues, this paper introduces a human-in-the-loop workflow for rapidly training building damage assessment models after a natural disaster. This article details a case study using this workflow, executed in partnership with the American Red Cross during a tornado event in Rolling Fork, Mississippi in March, 2023. The output from our human-in-the-loop modeling process achieved a precision of 0.86 and recall of 0.80 for damaged buildings when compared to ground truth data collected post-disaster. This workflow was implemented end-to-end in under 2 hours per satellite imagery scene, highlighting its potential for real-time deployment.
Mask Conditional Synthetic Satellite Imagery
Feb 08, 2023
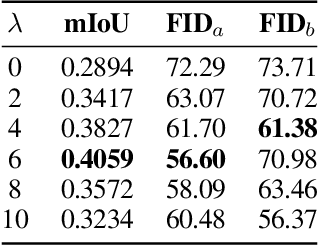
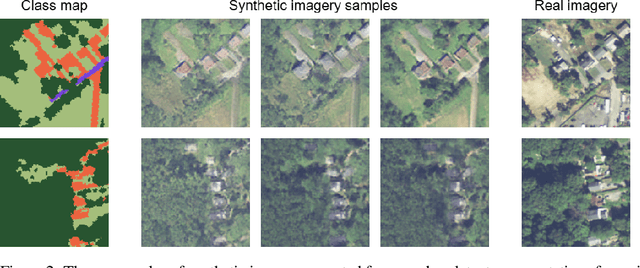

Abstract:In this paper we propose a mask-conditional synthetic image generation model for creating synthetic satellite imagery datasets. Given a dataset of real high-resolution images and accompanying land cover masks, we show that it is possible to train an upstream conditional synthetic imagery generator, use that generator to create synthetic imagery with the land cover masks, then train a downstream model on the synthetic imagery and land cover masks that achieves similar test performance to a model that was trained with the real imagery. Further, we find that incorporating a mixture of real and synthetic imagery acts as a data augmentation method, producing better models than using only real imagery (0.5834 vs. 0.5235 mIoU). Finally, we find that encouraging diversity of outputs in the upstream model is a necessary component for improved downstream task performance. We have released code for reproducing our work on GitHub, see https://github.com/ms-synthetic-satellite-image/synthetic-satellite-imagery .
 Add to Chrome
 Add to Firefox
 Add to Edge