Simone Fobi
Poverty rate prediction using multi-modal survey and earth observation data
Jul 21, 2023


Abstract:This work presents an approach for combining household demographic and living standards survey questions with features derived from satellite imagery to predict the poverty rate of a region. Our approach utilizes visual features obtained from a single-step featurization method applied to freely available 10m/px Sentinel-2 surface reflectance satellite imagery. These visual features are combined with ten survey questions in a proxy means test (PMT) to estimate whether a household is below the poverty line. We show that the inclusion of visual features reduces the mean error in poverty rate estimates from 4.09% to 3.88% over a nationally representative out-of-sample test set. In addition to including satellite imagery features in proxy means tests, we propose an approach for selecting a subset of survey questions that are complementary to the visual features extracted from satellite imagery. Specifically, we design a survey variable selection approach guided by the full survey and image features and use the approach to determine the most relevant set of small survey questions to include in a PMT. We validate the choice of small survey questions in a downstream task of predicting the poverty rate using the small set of questions. This approach results in the best performance -- errors in poverty rate decrease from 4.09% to 3.71%. We show that extracted visual features encode geographic and urbanization differences between regions.
Proceedings of the NeurIPS 2021 Workshop on Machine Learning for the Developing World: Global Challenges
Jan 10, 2023Abstract:These are the proceedings of the 5th workshop on Machine Learning for the Developing World (ML4D), held as part of the Thirty-fifth Conference on Neural Information Processing Systems (NeurIPS) on December 14th, 2021.
A Higher Purpose: Measuring Electricity Access Using High-Resolution Daytime Satellite Imagery
Oct 08, 2022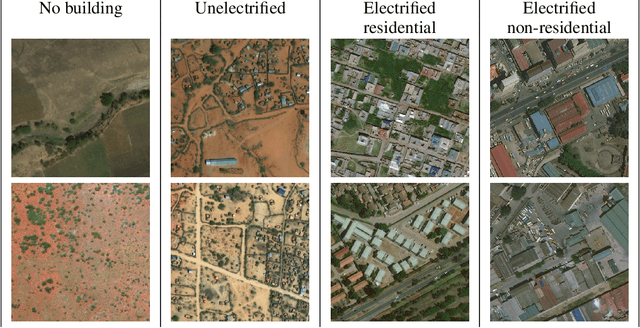

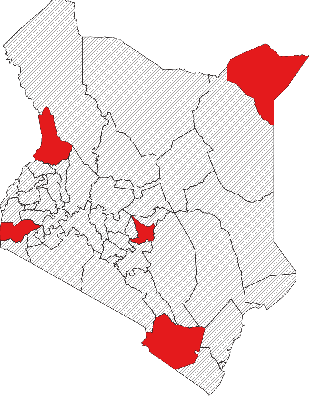
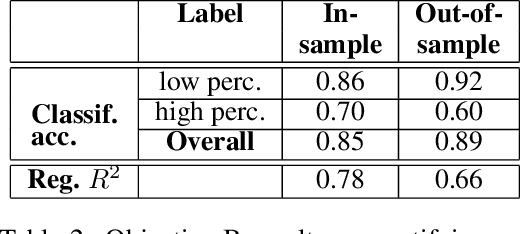
Abstract:Governments and international organizations the world over are investing towards the goal of achieving universal energy access for improving socio-economic development. However, in developing settings, monitoring electrification efforts is typically inaccurate, infrequent, and expensive. In this work, we develop and present techniques for high-resolution monitoring of electrification progress at scale. Specifically, our 3 unique contributions are: (i) identifying areas with(out) electricity access, (ii) quantifying the extent of electrification in electrified areas (percentage/number of electrified structures), and (iii) differentiating between customer types in electrified regions (estimating the percentage/number of residential/non-residential electrified structures). We combine high-resolution 50 cm daytime satellite images with Convolutional Neural Networks (CNNs) to train a series of classification and regression models. We evaluate our models using unique ground truth datasets on building locations, building types (residential/non-residential), and building electrification status. Our classification models show a 92% accuracy in identifying electrified regions, 85% accuracy in estimating percent of (low/high) electrified buildings within the region, and 69% accuracy in differentiating between (low/high) percentage of electrified residential buildings. Our regressions show $R^2$ scores of 78% and 80% in estimating the number of electrified buildings and number of residential electrified building in images respectively. We also demonstrate the generalizability of our models in never-before-seen regions to assess their potential for consistent and high-resolution measurements of electrification in emerging economies, and conclude by highlighting opportunities for improvement.
Predicting Levels of Household Electricity Consumption in Low-Access Settings
Dec 15, 2021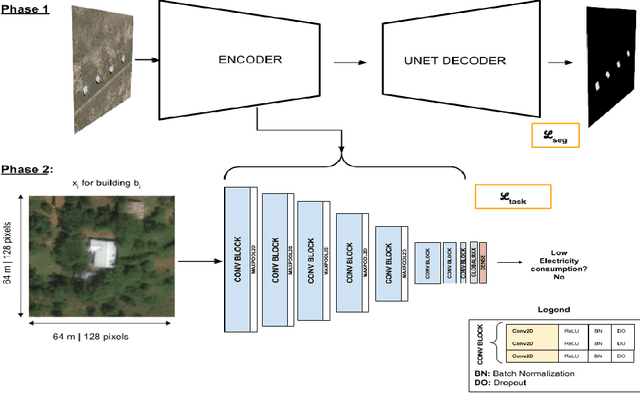
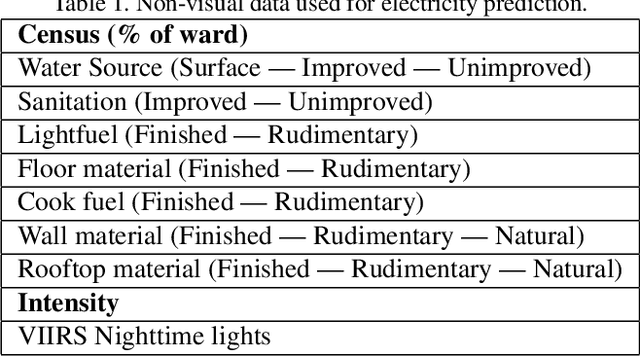

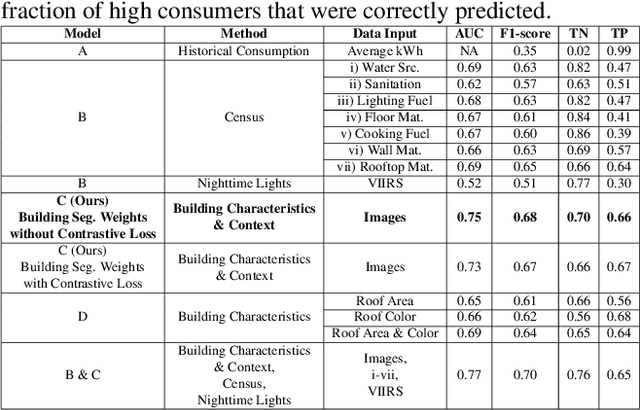
Abstract:In low-income settings, the most critical piece of information for electric utilities is the anticipated consumption of a customer. Electricity consumption assessment is difficult to do in settings where a significant fraction of households do not yet have an electricity connection. In such settings the absolute levels of anticipated consumption can range from 5-100 kWh/month, leading to high variability amongst these customers. Precious resources are at stake if a significant fraction of low consumers are connected over those with higher consumption. This is the first study of it's kind in low-income settings that attempts to predict a building's consumption and not that of an aggregate administrative area. We train a Convolutional Neural Network (CNN) over pre-electrification daytime satellite imagery with a sample of utility bills from 20,000 geo-referenced electricity customers in Kenya (0.01% of Kenya's residential customers). This is made possible with a two-stage approach that uses a novel building segmentation approach to leverage much larger volumes of no-cost satellite imagery to make the most of scarce and expensive customer data. Our method shows that competitive accuracies can be achieved at the building level, addressing the challenge of consumption variability. This work shows that the building's characteristics and it's surrounding context are both important in predicting consumption levels. We also evaluate the addition of lower resolution geospatial datasets into the training process, including nighttime lights and census-derived data. The results are already helping inform site selection and distribution-level planning, through granular predictions at the level of individual structures in Kenya and there is no reason this cannot be extended to other countries.
Learning to segment from misaligned and partial labels
May 27, 2020
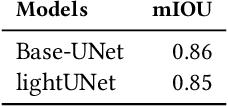
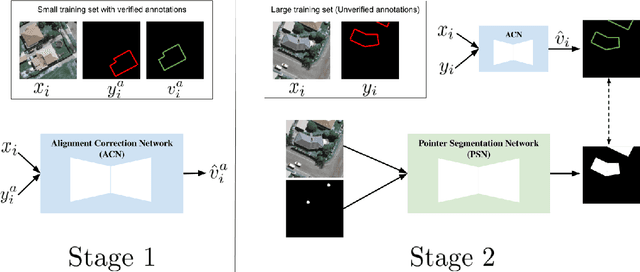
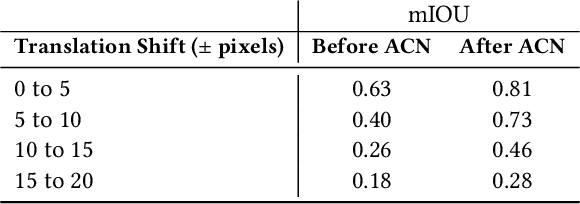
Abstract:To extract information at scale, researchers increasingly apply semantic segmentation techniques to remotely-sensed imagery. While fully-supervised learning enables accurate pixel-wise segmentation, compiling the exhaustive datasets required is often prohibitively expensive. As a result, many non-urban settings lack the ground-truth needed for accurate segmentation. Existing open source infrastructure data for these regions can be inexact and non-exhaustive. Open source infrastructure annotations like OpenStreetMaps (OSM) are representative of this issue: while OSM labels provide global insights to road and building footprints, noisy and partial annotations limit the performance of segmentation algorithms that learn from them. In this paper, we present a novel and generalizable two-stage framework that enables improved pixel-wise image segmentation given misaligned and missing annotations. First, we introduce the Alignment Correction Network to rectify incorrectly registered open source labels. Next, we demonstrate a segmentation model -- the Pointer Segmentation Network -- that uses corrected labels to predict infrastructure footprints despite missing annotations. We test sequential performance on the AIRS dataset, achieving a mean intersection-over-union score of 0.79; more importantly, model performance remains stable as we decrease the fraction of annotations present. We demonstrate the transferability of our method to lower quality data, by applying the Alignment Correction Network to OSM labels to correct building footprints; we also demonstrate the accuracy of the Pointer Segmentation Network in predicting cropland boundaries in California from medium resolution data. Overall, our methodology is robust for multiple applications with varied amounts of training data present, thus offering a method to extract reliable information from noisy, partial data.
 Add to Chrome
 Add to Firefox
 Add to Edge