Ziheng Duan
Total Scale: Face-to-Body Detail Reconstruction from Sparse RGBD Sensors
Dec 03, 2021


Abstract:While the 3D human reconstruction methods using Pixel-aligned implicit function (PIFu) develop fast, we observe that the quality of reconstructed details is still not satisfactory. Flat facial surfaces frequently occur in the PIFu-based reconstruction results. To this end, we propose a two-scale PIFu representation to enhance the quality of the reconstructed facial details. Specifically, we utilize two MLPs to separately represent the PIFus for the face and human body. An MLP dedicated to the reconstruction of 3D faces can increase the network capacity and reduce the difficulty of the reconstruction of facial details as in the previous one-scale PIFu representation. To remedy the topology error, we leverage 3 RGBD sensors to capture multiview RGBD data as the input to the network, a sparse, lightweight capture setting. Since the depth noise severely influences the reconstruction results, we design a depth refinement module to reduce the noise of the raw depths under the guidance of the input RGB images. We also propose an adaptive fusion scheme to fuse the predicted occupancy field of the body and face to eliminate the discontinuity artifact at their boundaries. Experiments demonstrate the effectiveness of our approach in reconstructing vivid facial details and deforming body shapes, and verify its superiority over state-of-the-art methods.
Multivariate Time Series Classification with Hierarchical Variational Graph Pooling
Oct 12, 2020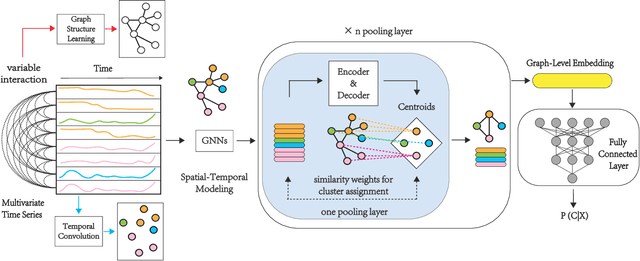
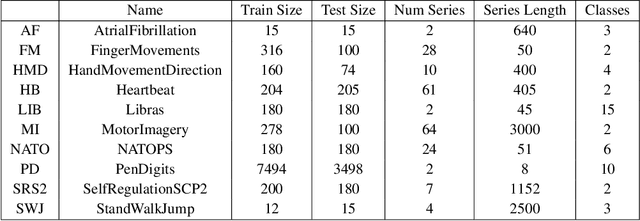
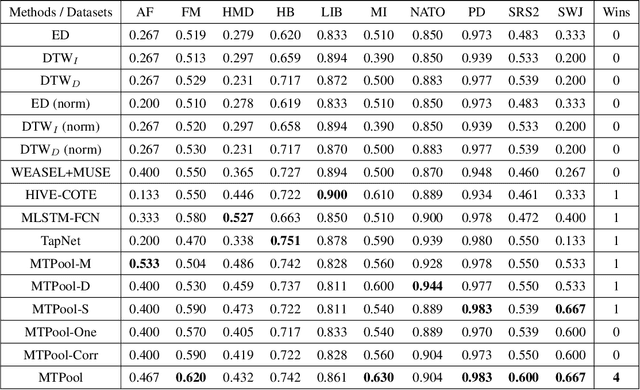

Abstract:Over the past decade, multivariate time series classification (MTSC) has received great attention with the advance of sensing techniques. Current deep learning methods for MTSC are based on convolutional and recurrent neural network, with the assumption that time series variables have the same effect to each other. Thus they cannot model the pairwise dependencies among variables explicitly. What's more, current spatial-temporal modeling methods based on GNNs are inherently flat and lack the capability of aggregating node information in a hierarchical manner. To address this limitation and attain expressive global representation of MTS, we propose a graph pooling based framework MTPool and view MTSC task as graph classification task. With graph structure learning and temporal convolution, MTS slices are converted to graphs and spatial-temporal features are extracted. Then, we propose a novel graph pooling method, which uses an ``encoder-decoder'' mechanism to generate adaptive centroids for cluster assignments. GNNs and graph pooling layers are used for joint graph representation learning and graph coarsening. With multiple graph pooling layers, the input graphs are hierachically coarsened to one node. Finally, differentiable classifier takes this coarsened one-node graph as input to get the final predicted class. Experiments on 10 benchmark datasets demonstrate MTPool outperforms state-of-the-art methods in MTSC tasks.
Modeling Complex Spatial Patterns with Temporal Features via Heterogenous Graph Embedding Networks
Sep 11, 2020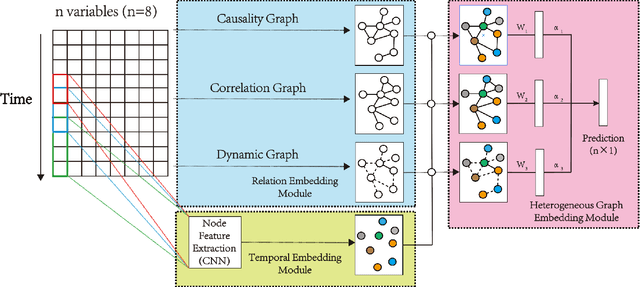
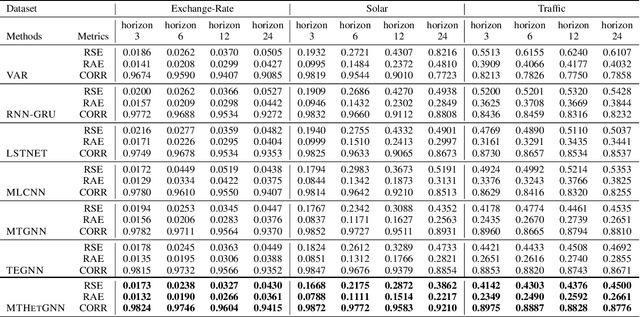
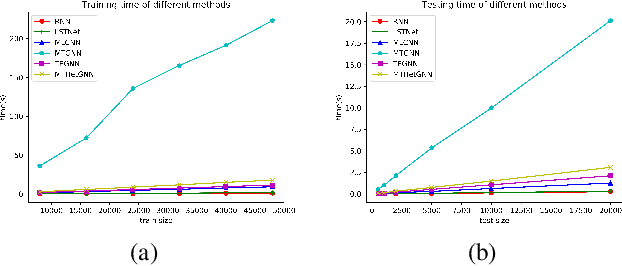
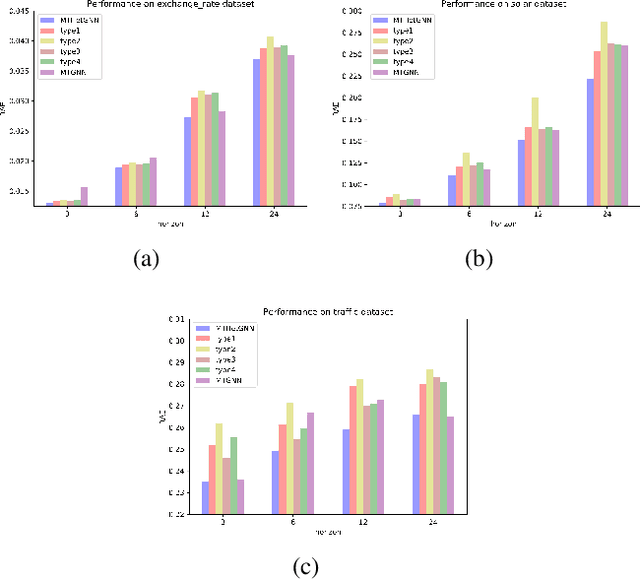
Abstract:Multivariate time series (MTS) forecasting is an important problem in many fields. Accurate forecasting results can effectively help decision-making. Variables in MTS have rich relations among each other and the value of each variable in MTS depends both on its historical values and on other variables. These rich relations can be static and predictable or dynamic and latent. Existing methods do not incorporate these rich relational information into modeling or only model certain relation among MTS variables. To jointly model rich relations among variables and temporal dependencies within the time series, a novel end-to-end deep learning model, termed Multivariate Time Series Forecasting via Heterogenous Graph Neural Networks (MTHetGNN) is proposed in this paper. To characterize rich relations among variables, a relation embedding module is introduced in our model, where each variable is regarded as a graph node and each type of edge represents a specific relationship among variables or one specific dynamic update strategy to model the latent dependency among variables. In addition, convolutional neural network (CNN) filters with different perception scales are used for time series feature extraction, which is used to generate the feature of each node. Finally, heterogenous graph neural networks are adopted to handle the complex structural information generated by temporal embedding module and relation embedding module. Three benchmark datasets from the real world are used to evaluate the proposed MTHetGNN and the comprehensive experiments show that MTHetGNN achieves state-of-the-art results in MTS forecasting task.
Parallel Extraction of Long-term Trends and Short-term Fluctuation Framework for Multivariate Time Series Forecasting
Sep 07, 2020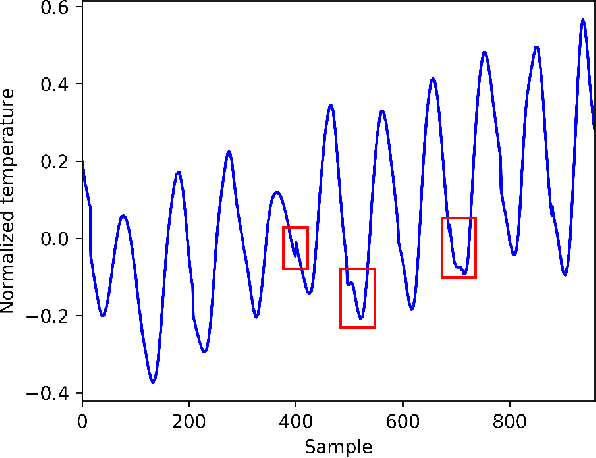
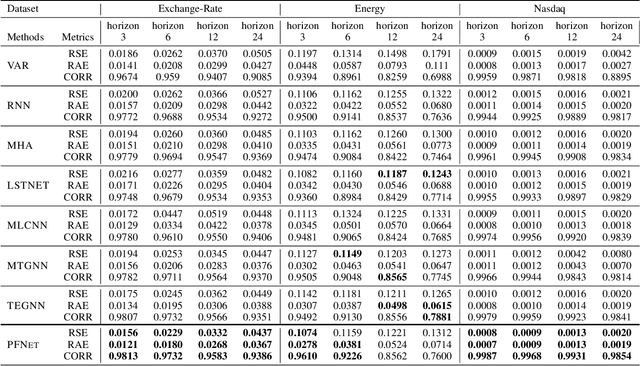

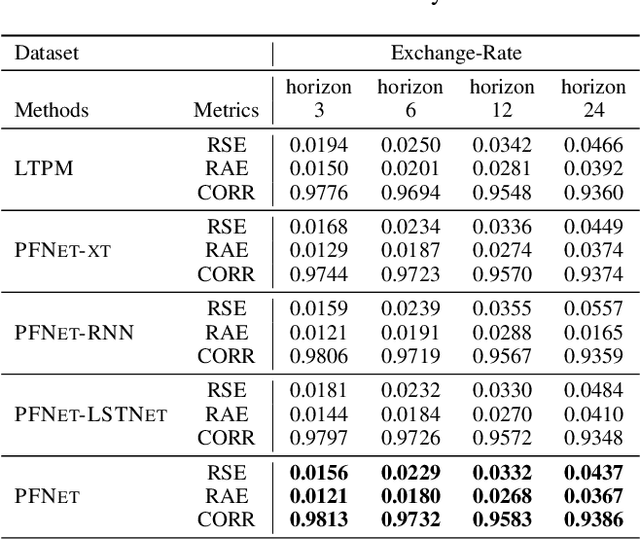
Abstract:Multivariate time series forecasting is widely used in various fields. Reasonable prediction results can assist people in planning and decision-making, generate benefits and avoid risks. Normally, there are two characteristics of time series, that is, long-term trend and short-term fluctuation. For example, stock prices will have a long-term upward trend with the market, but there may be a small decline in the short term. These two characteristics are often relatively independent of each other. However, the existing prediction methods often do not distinguish between them, which reduces the accuracy of the prediction model. In this paper, a MTS forecasting framework that can capture the long-term trends and short-term fluctuations of time series in parallel is proposed. This method uses the original time series and its first difference to characterize long-term trends and short-term fluctuations. Three prediction sub-networks are constructed to predict long-term trends, short-term fluctuations and the final value to be predicted. In the overall optimization goal, the idea of multi-task learning is used for reference, which is to make the prediction results of long-term trends and short-term fluctuations as close to the real values as possible while requiring to approximate the values to be predicted. In this way, the proposed method uses more supervision information and can more accurately capture the changing trend of the time series, thereby improving the forecasting performance.
Hierarchical Large-scale Graph Similarity Computation via Graph Coarsening and Matching
Jun 09, 2020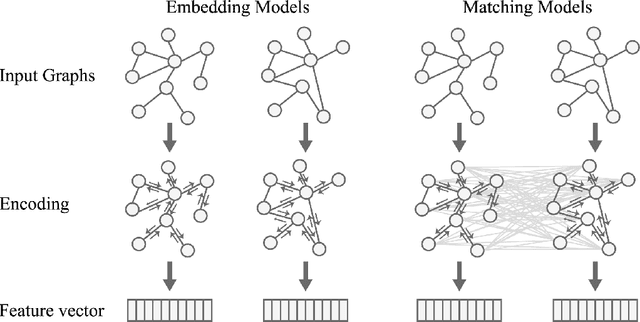
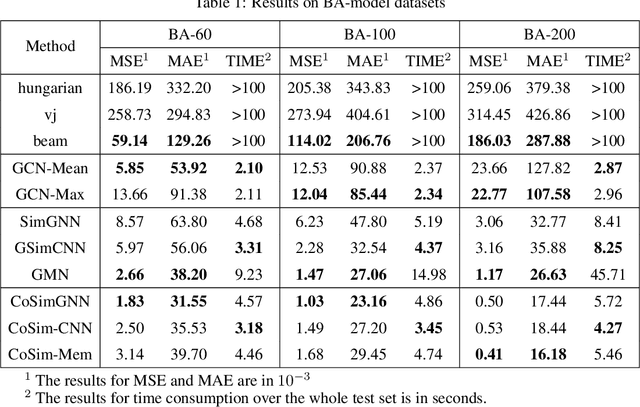
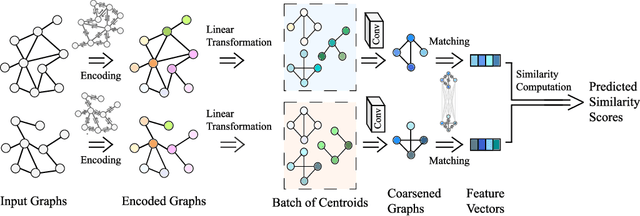
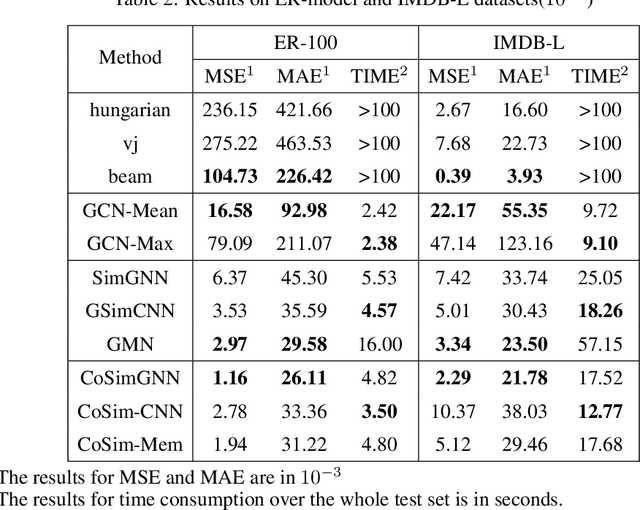
Abstract:In this work, we focus on large graph similarity computation problem and propose a novel ``embedding-coarsening-matching'' learning framework, which outperforms state-of-the-art methods in this task and has significant improvement in time efficiency. Graph similarity computation for metrics such as Graph Edit Distance (GED) is typically NP-hard, and existing heuristics-based algorithms usually achieves a unsatisfactory trade-off between accuracy and efficiency. Recently the development of deep learning techniques provides a promising solution for this problem by a data-driven approach which trains a network to encode graphs to their own feature vectors and computes similarity based on feature vectors. These deep-learning methods can be classified to two categories, embedding models and matching models. Embedding models such as GCN-Mean and GCN-Max, which directly map graphs to respective feature vectors, run faster but the performance is usually poor due to the lack of interactions across graphs. Matching models such as GMN, whose encoding process involves interaction across the two graphs, are more accurate but interaction between whole graphs brings a significant increase in time consumption (at least quadratic time complexity over number of nodes). Inspired by large biological molecular identification where the whole molecular is first mapped to functional groups and then identified based on these functional groups, our ``embedding-coarsening-matching'' learning framework first embeds and coarsens large graphs to coarsened graphs with denser local topology and then matching mechanism is deployed on the coarsened graphs for the final similarity scores. Detailed experiments have been conducted and the results demonstrate the efficiency and effectiveness of our proposed framework.
Deep Learning Based Detection and Localization of Cerebal Aneurysms in Computed Tomography Angiography
May 22, 2020


Abstract:Detecting cerebral aneurysms is an important clinical task of brain computed tomography angiography (CTA). However, human interpretation could be time consuming due to the small size of some aneurysms. In this work, we proposed DeepBrain, a deep learning based cerebral aneurysm detection and localization algorithm. The algorithm consisted of a 3D faster region-proposal convolution neural network for aneurysm detection and localization, and a 3D multi-scale fully convolutional neural network for false positive reduction. Furthermore, a novel hierarchical non-maximum suppression algorithm was proposed to process the detection results in 3D, which greatly reduced the time complexity by eliminating unnecessary comparisons. DeepBrain was trained and tested on 550 brain CTA scans and achieved sensitivity of 93.3% with 0.3 false positives per patient on average.
Graph Partitioning and Graph Neural Network based Hierarchical Graph Matching for Graph Similarity Computation
May 16, 2020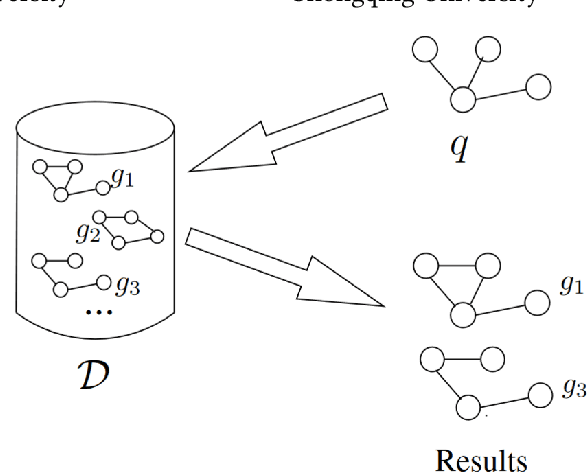
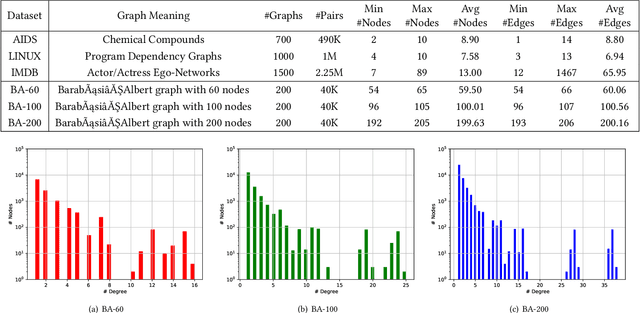

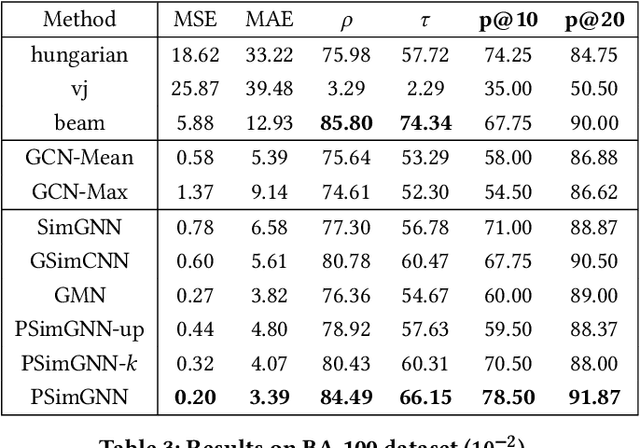
Abstract:Graph similarity computation aims to predict a similarity score between one pair of graphs so as to facilitate downstream applications, such as finding the chemical compounds that are most similar to a query compound or Fewshot 3D Action Recognition, \textit{etc}. Recently, some graph similarity computation models based on neural networks have been proposed, which are either based on graph-level interaction or node-level comparison. However, when the number of nodes in the graph increases, it will inevitably bring about the problem of reduced representation ability or excessive time complexity. Motivated by this observation, we propose a graph partitioning and graph neural network based model, called PSimGNN, to effectively resolve this issue. Specifically, each of the input graphs is partitioned into a set of subgraphs to directly extract the local structural features firstly. Next, a learnable embedding function is used to map each subgraph into an embedding vector. Then, some of these subgraph pairs are selected for node-level comparison to supplement the subgraph-level embedding with fine-grained information. Finally, coarse-grained interaction information among subgraphs and fine-grained comparison information among nodes in different subgraphs are integrated to predict the final similarity score. Using approximate Graph Edit Distance (GED) as graph similarity metric, experimental results on graph data sets of different graph size demonstrate PSimGNN outperforms state-of-the-art methods in graph similarity computation tasks. The codes will release when this paper is published.
Multivariate Time Series Forecasting Based on Causal Inference with Transfer Entropy and Graph Neural Network
May 03, 2020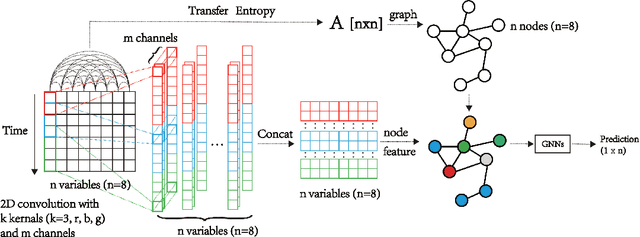
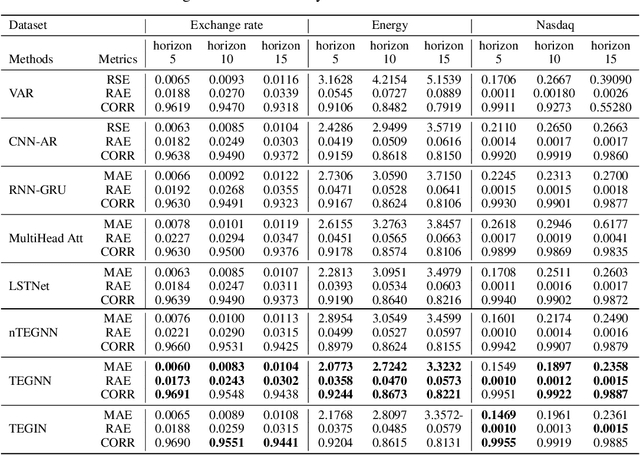

Abstract:Multivariate time series (MTS) forecasting is an important problem in many fields. Accurate forecasting results can effectively help decision-making and reduce subjectivity. To date, many MTS forecasting methods have been proposed and widely applied. However, these methods assume that the value to be predicted of a single variable is related to all other variables, which makes it difficult to select the true key variable in high-dimensional situations. To address the above issue, a novel end-to-end deep learning model, termed transfer entropy graph neural network (TEGNN) is proposed in this paper. For accurate variable selection, the transfer entropy (TE) graph is introduced to characterize the causal information among variables, in which each variable is regarded as a graph node. In addition, convolutional neural network (CNN) filters with different perception scales are used for time series feature extraction. What is more, graph neural network (GNN) is adopted to tackle the embedding and forecasting problem of graph structure composed of MTS. MTS data collected from the real world are used to evaluate the prediction performance of TEGNN. Our comprehensive experiments demonstrate that the proposed TEGNN consistently outperforms state-of-the-art MTS forecasting baselines.
 Add to Chrome
 Add to Firefox
 Add to Edge