Valerio Pascucci
See or Recall: A Sanity Check for the Role of Vision in Solving Visualization Question Answer Tasks with Multimodal LLMs
Apr 14, 2025Abstract:Recent developments in multimodal large language models (MLLM) have equipped language models to reason about vision and language jointly. This permits MLLMs to both perceive and answer questions about data visualization across a variety of designs and tasks. Applying MLLMs to a broad range of visualization tasks requires us to properly evaluate their capabilities, and the most common way to conduct evaluation is through measuring a model's visualization reasoning capability, analogous to how we would evaluate human understanding of visualizations (e.g., visualization literacy). However, we found that in the context of visualization question answering (VisQA), how an MLLM perceives and reasons about visualizations can be fundamentally different from how humans approach the same problem. During the evaluation, even without visualization, the model could correctly answer a substantial portion of the visualization test questions, regardless of whether any selection options were provided. We hypothesize that the vast amount of knowledge encoded in the language model permits factual recall that supersedes the need to seek information from the visual signal. It raises concerns that the current VisQA evaluation may not fully capture the models' visualization reasoning capabilities. To address this, we propose a comprehensive sanity check framework that integrates a rule-based decision tree and a sanity check table to disentangle the effects of "seeing" (visual processing) and "recall" (reliance on prior knowledge). This validates VisQA datasets for evaluation, highlighting where models are truly "seeing", positively or negatively affected by the factual recall, or relying on inductive biases for question answering. Our study underscores the need for careful consideration in designing future visualization understanding studies when utilizing MLLMs.
AVA: Towards Autonomous Visualization Agents through Visual Perception-Driven Decision-Making
Dec 07, 2023Abstract:With recent advances in multi-modal foundation models, the previously text-only large language models (LLM) have evolved to incorporate visual input, opening up unprecedented opportunities for various applications in visualization. Our work explores the utilization of the visual perception ability of multi-modal LLMs to develop Autonomous Visualization Agents (AVAs) that can interpret and accomplish user-defined visualization objectives through natural language. We propose the first framework for the design of AVAs and present several usage scenarios intended to demonstrate the general applicability of the proposed paradigm. The addition of visual perception allows AVAs to act as the virtual visualization assistant for domain experts who may lack the knowledge or expertise in fine-tuning visualization outputs. Our preliminary exploration and proof-of-concept agents suggest that this approach can be widely applicable whenever the choices of appropriate visualization parameters require the interpretation of previous visual output. Feedback from unstructured interviews with experts in AI research, medical visualization, and radiology has been incorporated, highlighting the practicality and potential of AVAs. Our study indicates that AVAs represent a general paradigm for designing intelligent visualization systems that can achieve high-level visualization goals, which pave the way for developing expert-level visualization agents in the future.
Instance-wise Linearization of Neural Network for Model Interpretation
Oct 25, 2023Abstract:Neural network have achieved remarkable successes in many scientific fields. However, the interpretability of the neural network model is still a major bottlenecks to deploy such technique into our daily life. The challenge can dive into the non-linear behavior of the neural network, which rises a critical question that how a model use input feature to make a decision. The classical approach to address this challenge is feature attribution, which assigns an important score to each input feature and reveal its importance of current prediction. However, current feature attribution approaches often indicate the importance of each input feature without detail of how they are actually processed by a model internally. These attribution approaches often raise a concern that whether they highlight correct features for a model prediction. For a neural network model, the non-linear behavior is often caused by non-linear activation units of a model. However, the computation behavior of a prediction from a neural network model is locally linear, because one prediction has only one activation pattern. Base on the observation, we propose an instance-wise linearization approach to reformulates the forward computation process of a neural network prediction. This approach reformulates different layers of convolution neural networks into linear matrix multiplication. Aggregating all layers' computation, a prediction complex convolution neural network operations can be described as a linear matrix multiplication $F(x) = W \cdot x + b$. This equation can not only provides a feature attribution map that highlights the important of the input features but also tells how each input feature contributes to a prediction exactly. Furthermore, we discuss the application of this technique in both supervise classification and unsupervised neural network learning parametric t-SNE dimension reduction.
"Understanding Robustness Lottery": A Comparative Visual Analysis of Neural Network Pruning Approaches
Jun 16, 2022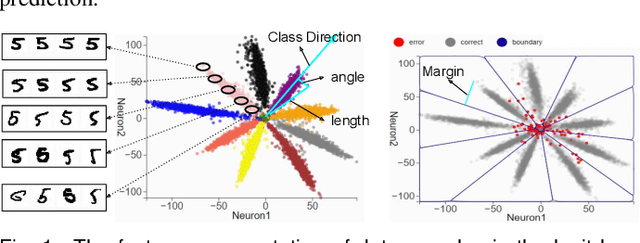

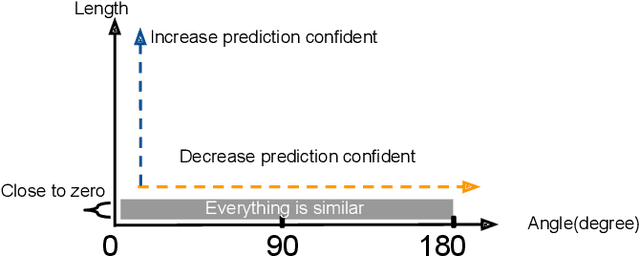
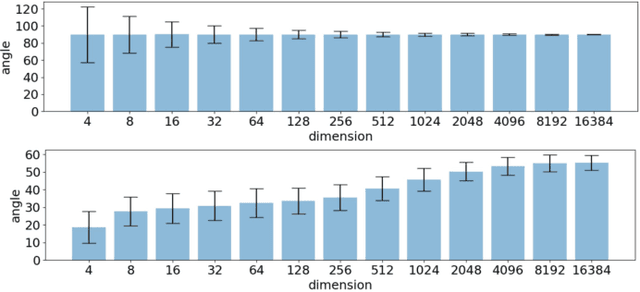
Abstract:Deep learning approaches have provided state-of-the-art performance in many applications by relying on extremely large and heavily overparameterized neural networks. However, such networks have been shown to be very brittle, not generalize well to new uses cases, and are often difficult if not impossible to deploy on resources limited platforms. Model pruning, i.e., reducing the size of the network, is a widely adopted strategy that can lead to more robust and generalizable network -- usually orders of magnitude smaller with the same or even improved performance. While there exist many heuristics for model pruning, our understanding of the pruning process remains limited. Empirical studies show that some heuristics improve performance while others can make models more brittle or have other side effects. This work aims to shed light on how different pruning methods alter the network's internal feature representation, and the corresponding impact on model performance. To provide a meaningful comparison and characterization of model feature space, we use three geometric metrics that are decomposed from the common adopted classification loss. With these metrics, we design a visualization system to highlight the impact of pruning on model prediction as well as the latent feature embedding. The proposed tool provides an environment for exploring and studying differences among pruning methods and between pruned and original model. By leveraging our visualization, the ML researchers can not only identify samples that are fragile to model pruning and data corruption but also obtain insights and explanations on how some pruned models achieve superior robustness performance.
NViSII: A Scriptable Tool for Photorealistic Image Generation
May 28, 2021


Abstract:We present a Python-based renderer built on NVIDIA's OptiX ray tracing engine and the OptiX AI denoiser, designed to generate high-quality synthetic images for research in computer vision and deep learning. Our tool enables the description and manipulation of complex dynamic 3D scenes containing object meshes, materials, textures, lighting, volumetric data (e.g., smoke), and backgrounds. Metadata, such as 2D/3D bounding boxes, segmentation masks, depth maps, normal maps, material properties, and optical flow vectors, can also be generated. In this work, we discuss design goals, architecture, and performance. We demonstrate the use of data generated by path tracing for training an object detector and pose estimator, showing improved performance in sim-to-real transfer in situations that are difficult for traditional raster-based renderers. We offer this tool as an easy-to-use, performant, high-quality renderer for advancing research in synthetic data generation and deep learning.
Scalable Topological Data Analysis and Visualization for Evaluating Data-Driven Models in Scientific Applications
Jul 19, 2019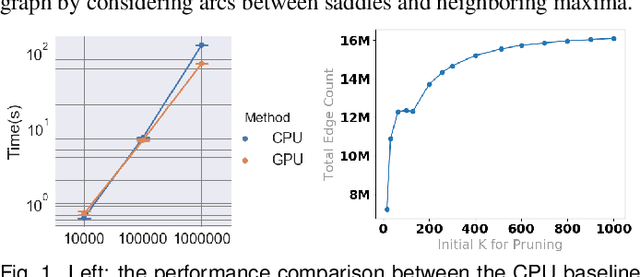
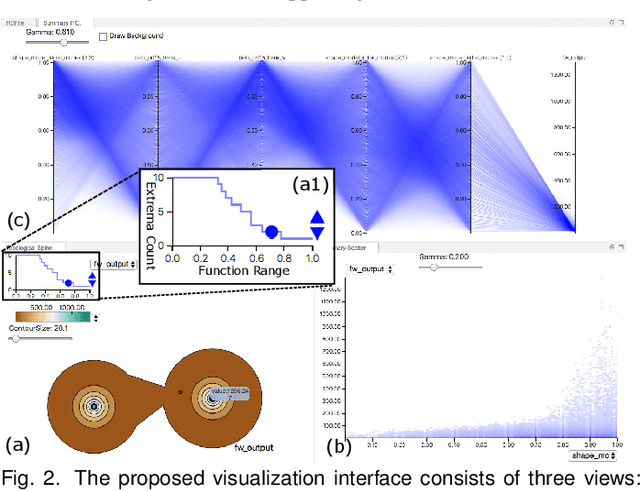
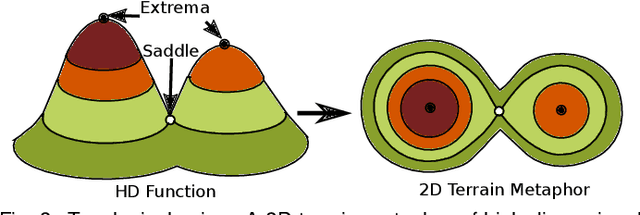
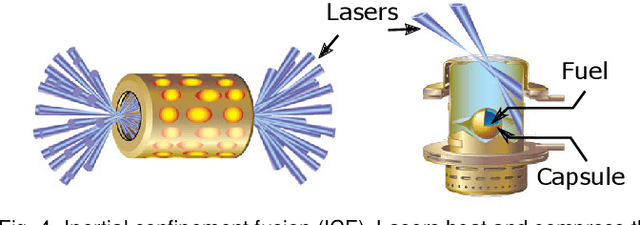
Abstract:With the rapid adoption of machine learning techniques for large-scale applications in science and engineering comes the convergence of two grand challenges in visualization. First, the utilization of black box models (e.g., deep neural networks) calls for advanced techniques in exploring and interpreting model behaviors. Second, the rapid growth in computing has produced enormous datasets that require techniques that can handle millions or more samples. Although some solutions to these interpretability challenges have been proposed, they typically do not scale beyond thousands of samples, nor do they provide the high-level intuition scientists are looking for. Here, we present the first scalable solution to explore and analyze high-dimensional functions often encountered in the scientific data analysis pipeline. By combining a new streaming neighborhood graph construction, the corresponding topology computation, and a novel data aggregation scheme, namely topology aware datacubes, we enable interactive exploration of both the topological and the geometric aspect of high-dimensional data. Following two use cases from high-energy-density (HED) physics and computational biology, we demonstrate how these capabilities have led to crucial new insights in both applications.
 Add to Chrome
 Add to Firefox
 Add to Edge