Mark Tygert
Measuring multi-calibration
Jun 12, 2025Abstract:A suitable scalar metric can help measure multi-calibration, defined as follows. When the expected values of observed responses are equal to corresponding predicted probabilities, the probabilistic predictions are known as "perfectly calibrated." When the predicted probabilities are perfectly calibrated simultaneously across several subpopulations, the probabilistic predictions are known as "perfectly multi-calibrated." In practice, predicted probabilities are seldom perfectly multi-calibrated, so a statistic measuring the distance from perfect multi-calibration is informative. A recently proposed metric for calibration, based on the classical Kuiper statistic, is a natural basis for a new metric of multi-calibration and avoids well-known problems of metrics based on binning or kernel density estimation. The newly proposed metric weights the contributions of different subpopulations in proportion to their signal-to-noise ratios; data analyses' ablations demonstrate that the metric becomes noisy when omitting the signal-to-noise ratios from the metric. Numerical examples on benchmark data sets illustrate the new metric.
Guarantees of confidentiality via Hammersley-Chapman-Robbins bounds
Apr 06, 2024


Abstract:Protecting privacy during inference with deep neural networks is possible by adding noise to the activations in the last layers prior to the final classifiers or other task-specific layers. The activations in such layers are known as "features" (or, less commonly, as "embeddings" or "feature embeddings"). The added noise helps prevent reconstruction of the inputs from the noisy features. Lower bounding the variance of every possible unbiased estimator of the inputs quantifies the confidentiality arising from such added noise. Convenient, computationally tractable bounds are available from classic inequalities of Hammersley and of Chapman and Robbins -- the HCR bounds. Numerical experiments indicate that the HCR bounds are on the precipice of being effectual for small neural nets with the data sets, "MNIST" and "CIFAR-10," which contain 10 classes each for image classification. The HCR bounds appear to be insufficient on their own to guarantee confidentiality of the inputs to inference with standard deep neural nets, "ResNet-18" and "Swin-T," pre-trained on the data set, "ImageNet-1000," which contains 1000 classes. Supplementing the addition of noise to features with other methods for providing confidentiality may be warranted in the case of ImageNet. In all cases, the results reported here limit consideration to amounts of added noise that incur little degradation in the accuracy of classification from the noisy features. Thus, the added noise enhances confidentiality without much reduction in the accuracy on the task of image classification.
Metrics of calibration for probabilistic predictions
May 19, 2022


Abstract:Predictions are often probabilities; e.g., a prediction could be for precipitation tomorrow, but with only a 30% chance. Given such probabilistic predictions together with the actual outcomes, "reliability diagrams" help detect and diagnose statistically significant discrepancies -- so-called "miscalibration" -- between the predictions and the outcomes. The canonical reliability diagrams histogram the observed and expected values of the predictions; replacing the hard histogram binning with soft kernel density estimation is another common practice. But, which widths of bins or kernels are best? Plots of the cumulative differences between the observed and expected values largely avoid this question, by displaying miscalibration directly as the slopes of secant lines for the graphs. Slope is easy to perceive with quantitative precision, even when the constant offsets of the secant lines are irrelevant; there is no need to bin or perform kernel density estimation. The existing standard metrics of miscalibration each summarize a reliability diagram as a single scalar statistic. The cumulative plots naturally lead to scalar metrics for the deviation of the graph of cumulative differences away from zero; good calibration corresponds to a horizontal, flat graph which deviates little from zero. The cumulative approach is currently unconventional, yet offers many favorable statistical properties, guaranteed via mathematical theory backed by rigorous proofs and illustrative numerical examples. In particular, metrics based on binning or kernel density estimation unavoidably must trade-off statistical confidence for the ability to resolve variations as a function of the predicted probability or vice versa. Widening the bins or kernels averages away random noise while giving up some resolving power. Narrowing the bins or kernels enhances resolving power while not averaging away as much noise.
Calibration of P-values for calibration and for deviation of a subpopulation from the full population
Jan 31, 2022


Abstract:The author's recent research papers, "Cumulative deviation of a subpopulation from the full population" and "A graphical method of cumulative differences between two subpopulations" (both published in volume 8 of Springer's open-access "Journal of Big Data" during 2021), propose graphical methods and summary statistics, without extensively calibrating formal significance tests. The summary metrics and methods can measure the calibration of probabilistic predictions and can assess differences in responses between a subpopulation and the full population while controlling for a covariate or score via conditioning on it. These recently published papers construct significance tests based on the scalar summary statistics, but only sketch how to calibrate the attained significance levels (also known as "P-values") for the tests. The present article reviews and synthesizes work spanning many decades in order to detail how to calibrate the P-values. The present paper presents computationally efficient, easily implemented numerical methods for evaluating properly calibrated P-values, together with rigorous mathematical proofs guaranteeing their accuracy, and illustrates and validates the methods with open-source software and numerical examples.
An optimizable scalar objective value cannot be objective and should not be the sole objective
Jun 03, 2020Abstract:This paper concerns the ethics and morality of algorithms and computational systems, and has been circulating internally at Facebook for the past couple years. The paper reviews many Nobel laureates' work, as well as the work of other prominent scientists such as Richard Dawkins, Andrei Kolmogorov, Vilfredo Pareto, and John von Neumann. The paper draws conclusions based on such works, as summarized in the title. The paper argues that the standard approach to modern machine learning and artificial intelligence is bound to be biased and unfair, and that longstanding traditions in the professions of law, justice, politics, and medicine should help.
Plots of the cumulative differences between observed and expected values of ordered Bernoulli variates
Jun 03, 2020


Abstract:Many predictions are probabilistic in nature; for example, a prediction could be for precipitation tomorrow, but with only a 30 percent chance. Given both the predictions and the actual outcomes, "reliability diagrams" (also known as "calibration plots") help detect and diagnose statistically significant discrepancies between the predictions and the outcomes. The canonical reliability diagrams are based on histogramming the observed and expected values of the predictions; several variants of the standard reliability diagrams propose to replace the hard histogram binning with soft kernel density estimation using smooth convolutional kernels of widths similar to the widths of the bins. In all cases, an important question naturally arises: which widths are best (or are multiple plots with different widths better)? Rather than answering this question, plots of the cumulative differences between the observed and expected values largely avoid the question, by displaying miscalibration directly as the slopes of secant lines for the graphs. Slope is easy to perceive with quantitative precision even when the constant offsets of the secant lines are irrelevant. There is no need to bin or perform kernel density estimation with a somewhat arbitrary kernel.
Secure multiparty computations in floating-point arithmetic
Jan 09, 2020


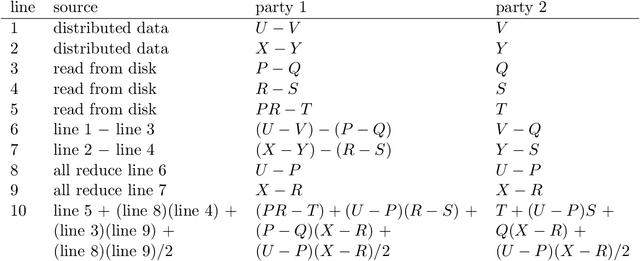
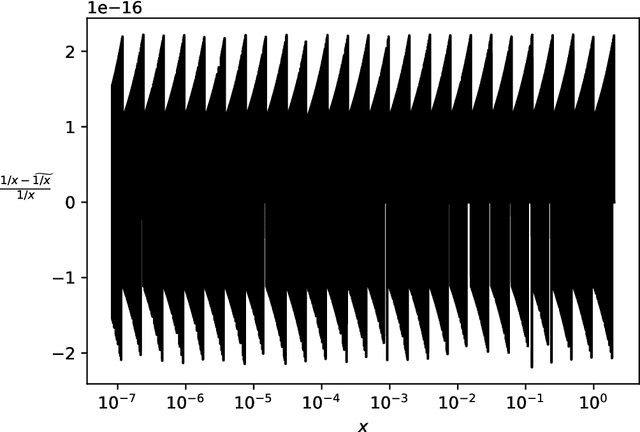
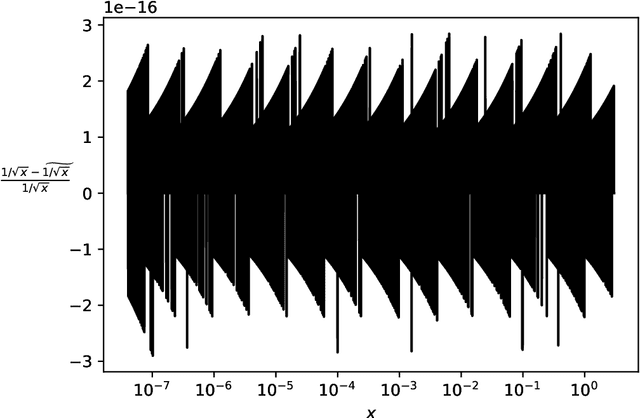
Abstract:Secure multiparty computations enable the distribution of so-called shares of sensitive data to multiple parties such that the multiple parties can effectively process the data while being unable to glean much information about the data (at least not without collusion among all parties to put back together all the shares). Thus, the parties may conspire to send all their processed results to a trusted third party (perhaps the data provider) at the conclusion of the computations, with only the trusted third party being able to view the final results. Secure multiparty computations for privacy-preserving machine-learning turn out to be possible using solely standard floating-point arithmetic, at least with a carefully controlled leakage of information less than the loss of accuracy due to roundoff, all backed by rigorous mathematical proofs of worst-case bounds on information loss and numerical stability in finite-precision arithmetic. Numerical examples illustrate the high performance attained on commodity off-the-shelf hardware for generalized linear models, including ordinary linear least-squares regression, binary and multinomial logistic regression, probit regression, and Poisson regression.
Regression-aware decompositions
Feb 12, 2018


Abstract:Linear least-squares regression with a "design" matrix A approximates a given matrix B via minimization of the spectral- or Frobenius-norm discrepancy ||AX-B|| over every conformingly sized matrix X. Another popular approximation is low-rank approximation via principal component analysis (PCA) -- which is essentially singular value decomposition (SVD) -- or interpolative decomposition (ID). Classically, PCA/SVD and ID operate solely with the matrix B being approximated, not supervised by any auxiliary matrix A. However, linear least-squares regression models can inform the ID, yielding regression-aware ID. As a bonus, this provides an interpretation as regression-aware PCA for a kind of canonical correlation analysis between A and B. The regression-aware decompositions effectively enable supervision to inform classical dimensionality reduction, which classically has been totally unsupervised. The regression-aware decompositions reveal the structure inherent in B that is relevant to regression against A.
Convolutional networks and learning invariant to homogeneous multiplicative scalings
Feb 16, 2016


Abstract:The conventional classification schemes -- notably multinomial logistic regression -- used in conjunction with convolutional networks (convnets) are classical in statistics, designed without consideration for the usual coupling with convnets, stochastic gradient descent, and backpropagation. In the specific application to supervised learning for convnets, a simple scale-invariant classification stage turns out to be more robust than multinomial logistic regression, appears to result in slightly lower errors on several standard test sets, has similar computational costs, and features precise control over the actual rate of learning. "Scale-invariant" means that multiplying the input values by any nonzero scalar leaves the output unchanged.
* 12 pages, 6 figures, 4 tables
Poor starting points in machine learning
Feb 09, 2016


Abstract:Poor (even random) starting points for learning/training/optimization are common in machine learning. In many settings, the method of Robbins and Monro (online stochastic gradient descent) is known to be optimal for good starting points, but may not be optimal for poor starting points -- indeed, for poor starting points Nesterov acceleration can help during the initial iterations, even though Nesterov methods not designed for stochastic approximation could hurt during later iterations. The common practice of training with nontrivial minibatches enhances the advantage of Nesterov acceleration.
 Add to Chrome
 Add to Firefox
 Add to Edge